eTransport
User interface
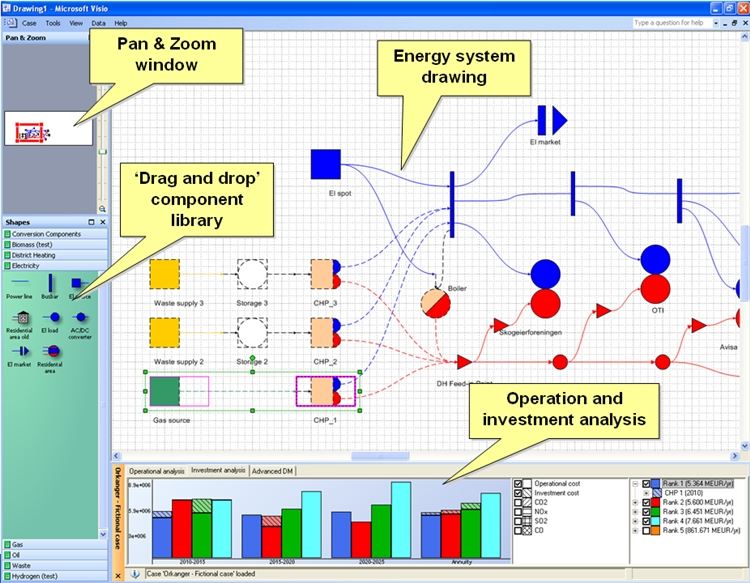
The GUI consists of three main parts:
The Component Library to the left, the main Drawing Area, and the Results Window at the bottom of the screen:

The user designs the energy system model by dragging modules from the component library and dropping them in the drawing area. All data and assumptions are given in dialog boxes in this interface without editing complex code or data files. Once the model setup is complete, the combined operation and investment analysis is run and the various alternatives are ranked according to total net present value at the bottom right of the result window. Several investment objects can be included in one investment alternative, so the list is formatted as a directory tree. Furthermore, there is a link between this tree structure and the drawing area such that clicking on one alternative or object will highlight the respective object(s) in the drawing area.

By choosing the respective emission factors in the click boxes, e.g. CO2 emissions can be added to the diagram to see how this might influence the ranking of alternatives. Note that in this example, emissions are not included in the optimization as part of the operational cost but this can easily be done by setting an emission cost (emission tax).

Diurnal operation of each component can be inspected for all investment alternatives, years and seasons (e.g. Peak load, Low load, Intermediate) in the Operational analysis display:

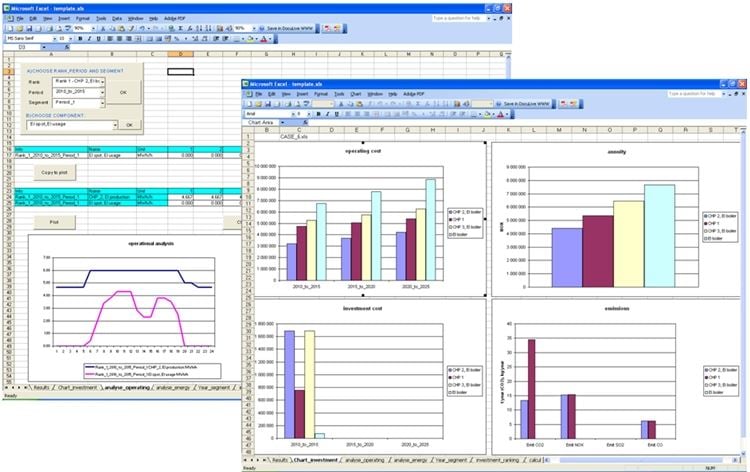
Note that the displays in the eTransport GUI are meant mostly as tools during the analyses. All variables and parameters can be exported to Excel to generate graphs for final reporting.
