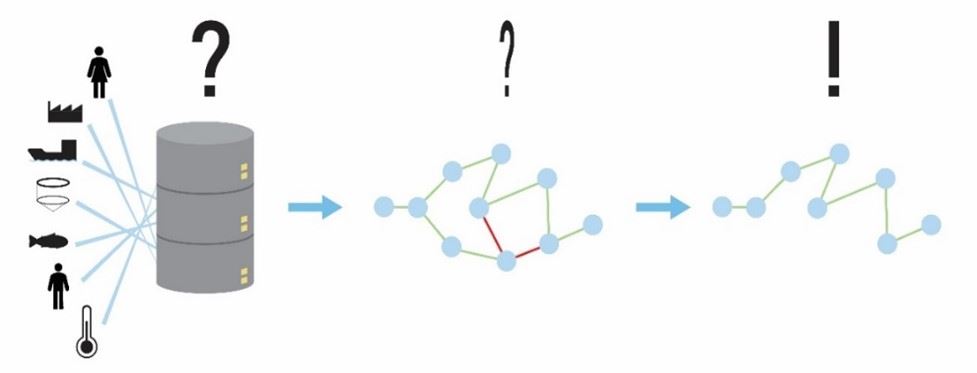
The AquaGraph project aims to enable end-users in the aquaculture sector to observe complex interconnections in their production data.The aquaculture industry generates enormous amounts of data every day. Data comes from sensors in the fish cages, cameras, boats, feeding centrals, but also from e-mails and notes made by the people working on the production sites as veterinarians, farmers, or managers. Large data sets are challenging to navigate, and many interconnections will be difficult to detect using today's solutions. Thus, the potential value of the generated data, in terms of improving aquaculture production, is still not fully exploited.
Present-day techniques for gathering and displaying the produced aquaculture data involve challenges related to finding and visualising the interconnections within the gathered data. High quantities of data make it difficult for operators to navigate through millions of data points in a table. Furthermore, when the data quantity is high, the interconnections between the data become as important as the data itself. Typically, relational databases are used, which do not robustly store or display relationships between the data.

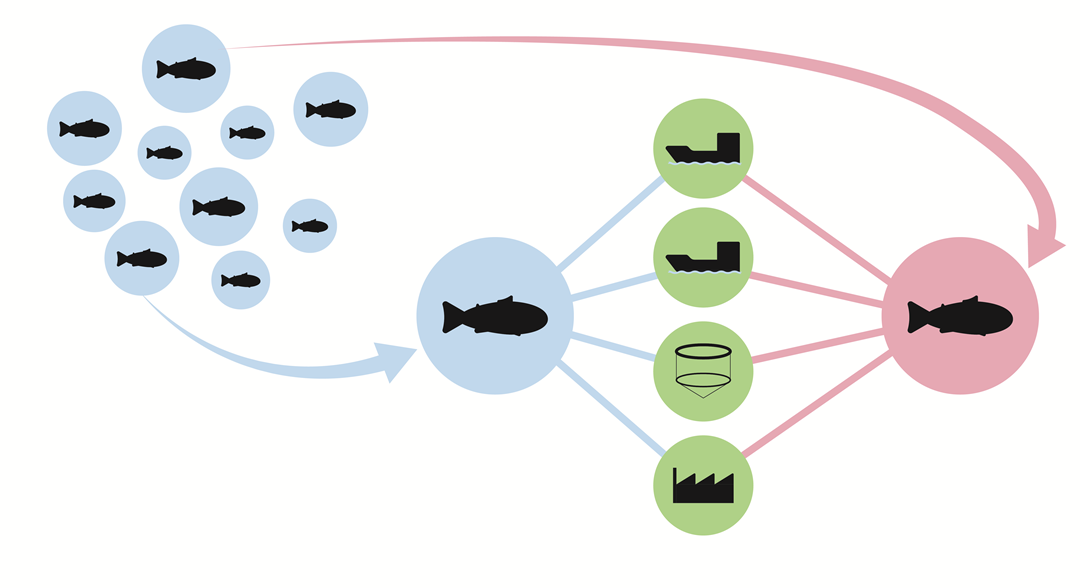
Illustration of the AquaGraph concept. Data from assets in the aquaculture industry is organized in a graph database for improved interpretation of the interconnections in data. Illustration: Mats Mulelid, SINTEF Ocean AS.
Discovering subtle interconnections is currently an experience-based effort among the fish farm operators. The precision fish farming concept emphasises the need for increased observability and understanding of data, creating a knowledge-based decision-making process in the aquaculture industry. Going from experience- to knowledge-based decision-making will enable end-users in the aquaculture sector to observe complex interconnections and optimize production.
The AquaGraph project intends to create a novel software tool to investigate production optimization and visualisation of complex interconnections in aquaculture data using graph databases. The integration of production data in a graph database aspires to provide fish farmers, research communities, governmental bodies, and other interested parties improved insight into interconnections between variables through novel visualisation of data. The project will focus the research activities (RA) towards: RA1: Graph database foundation, RA2: Visualisation of data in graph databases and RA3: Using graph databases to improve aquaculture operations. The developed tool will contribute to the digitalization of the aquaculture industry, more optimal production, and improved decision support by combining methods from computer science, cybernetics, and the precision fish farming concept.
The primary objective of AquaGraph is to create a software tool based on graph databases that enables the end-users to observe complex interconnections in their production data, which will make optimization of the production possible. The primary objective is built upon the following secondary objectives:
- Secondary objective 1: Identify the requirements and specifications needed to structure and integrate aquaculture data in graph databases.
- Secondary objective 2: Visualise the gathered data.
- Secondary objective 3: Develop methods for optimization and decision support.
- Secondary objective 4: Validate the developed technologies in relevant case studies.


