By Åse Dragland
In the grey light of morning and squally weather a fishing boat stops its engine. The fisherman knows he is outside the baseline and has to notify the Coastguard before setting his nets. He phones the office in Sortland and states his GPS coordinates in order to avoid collision with other boats’ fishing gear.
“He then receives a reply in the form of an Excel spreadsheet, listing his own position and that of other fishing vessels setting nets and lines in the area,” explains Ståle Walderhaug at SINTEF ICT. “He must then enter all these positions manually into his map plotter to create a visual picture of the situation. This has always been a problem.”
Automatic information
Last year, SINTEF was approached by the Norwegian Fisheries and Aquaculture Industry Research Fund, seeking a better way for fishermen to report fishing gear deployment. Sheets of paper lying around all mixed up with coffee cups and fishing gear was never a good solution. And typing in coordinates in darkness and in rough seas is far from easy.
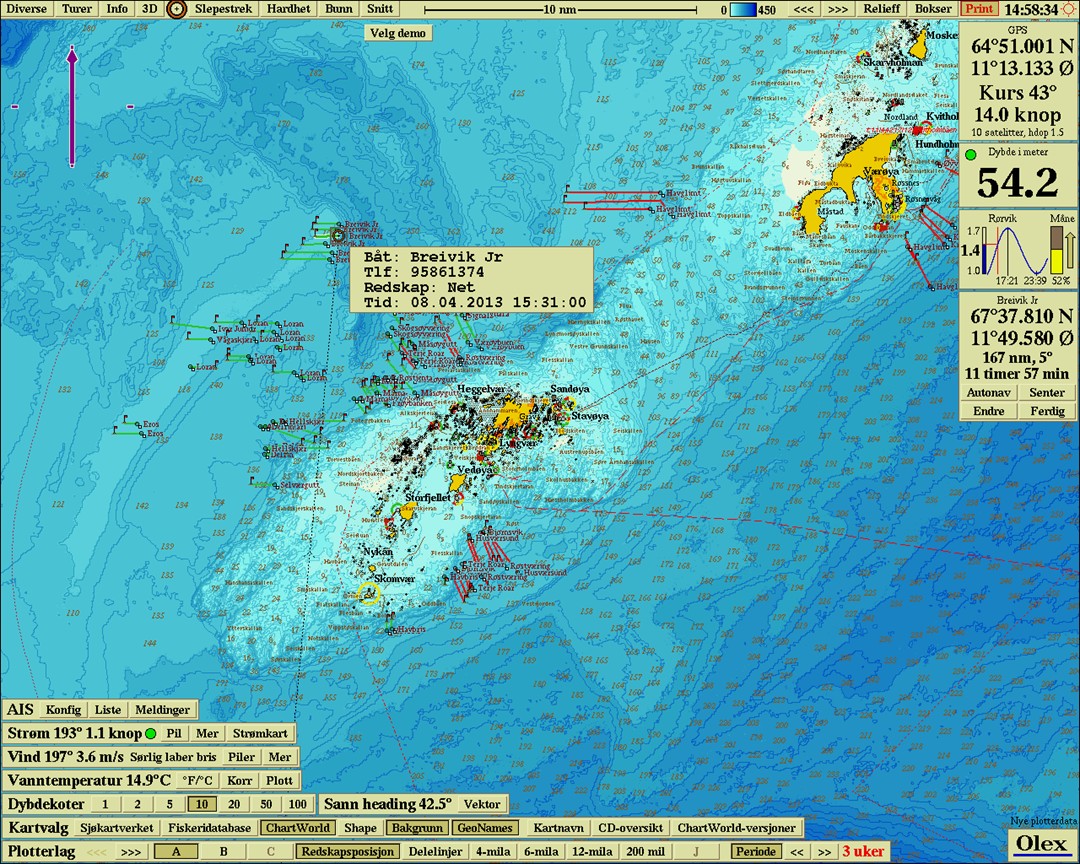
A new system has now been in operation since April. Instead of a spreadsheet, the Coastguard sends the fisherman a file which can be read into a map plotter.
New method
“The fisherman saves the attachment received from the Coastguard on a memory stick, which he then inserts into the map plotter. The names of other vessels in the area, and details of their fishing gear, are then displayed on a screen. So manual operations are unnecessary,” says Ståle Walderhaug.
The innovation uses programming developed by research scientists to interpret information received by the Coastguard and relay updated data to the fishing vessels.
Happy fishermen
According to Frank Ludvigsen in the Coastguard Operations Room, feedback from fishermen has been nothing but positive. “They feel that the new system considerably reduces their workload,” he says.
Because the system will be used by everybody from seventy year-old fishermen along the Finnmark coast to youngsters in Møre, it’s important to understand the users’ needs and make the method as simple as possible. SINTEF Fisheries and Aquaculture has contributed specifications, and system development has been based on discussions with key operators in the industry.
When users first phone the Coastguard Operations Room they can now choose whether to receive information as a spreadsheet, as in the past, or as a file to be read into the plotter.
The Development Section of the Directory of Fisheries in Bergen has also voiced its satisfaction with the new map plotter. Every year it has to clear away lost nets and other equipment from the seabed, and Senior Adviser Gjermund Langedal says it’s easier to plan and carry out searches using continuously updated information about fishing gear currently in use.
Follow-up project
Ståle Walderhaug at SINTEF tells us that a follow-up project is now in progress to look into the reporting method.
“We would like to replace telephone calls with pressing a button on the plotter. Making phone calls is time-consuming, and when people are busy and a lot is going on, such as during Lofoten fishing operations, it would be beneficial to simplify the process and reduce the response time.”
KEY FACTS:
• The map plotter project was commissioned by the Norwegian Fisheries and Aquaculture Industry Research Fund (FHF).
• FHF’s mission is to safeguard the interests and needs of researchers, financed by an annual levy of NOK 250 million.
• Map plotters are supplied by Furuno and Olex, which have been involved in the project as partners.

