2016: Scientific Visualization
![]()
Visualization is an integral part of science, and a necessity for our understanding of complex processes and data. The word visualization can have a broad interpretation, including creating trivial plots of values, advanced rendering techniques, and complex statistical data reasoning. This winter school will target the process of understanding data through scientific visualization, and focus on extracting knowledge from data. With hands-on exercises you will during the course of this winter school learn techniques, tools, and best practices for extracting knowledge from data.
Program and Schedule
Program:
The school will start on Sunday January 17th with an afternoon lecture, and continue until Friday January 22nd after lunch. The school is adapted to fit well with the train schedule from both Bergen and Oslo. The handout booklet is available here.
The schedule consists of a morning lecture each day, a long mid-day break suitable for social activities and skiing, and two afternoon lectures. In the evening, all participants dine together. There is also a poster session scheduled for Wednesday afternoon.
The topic abstracts are described further down on this page.
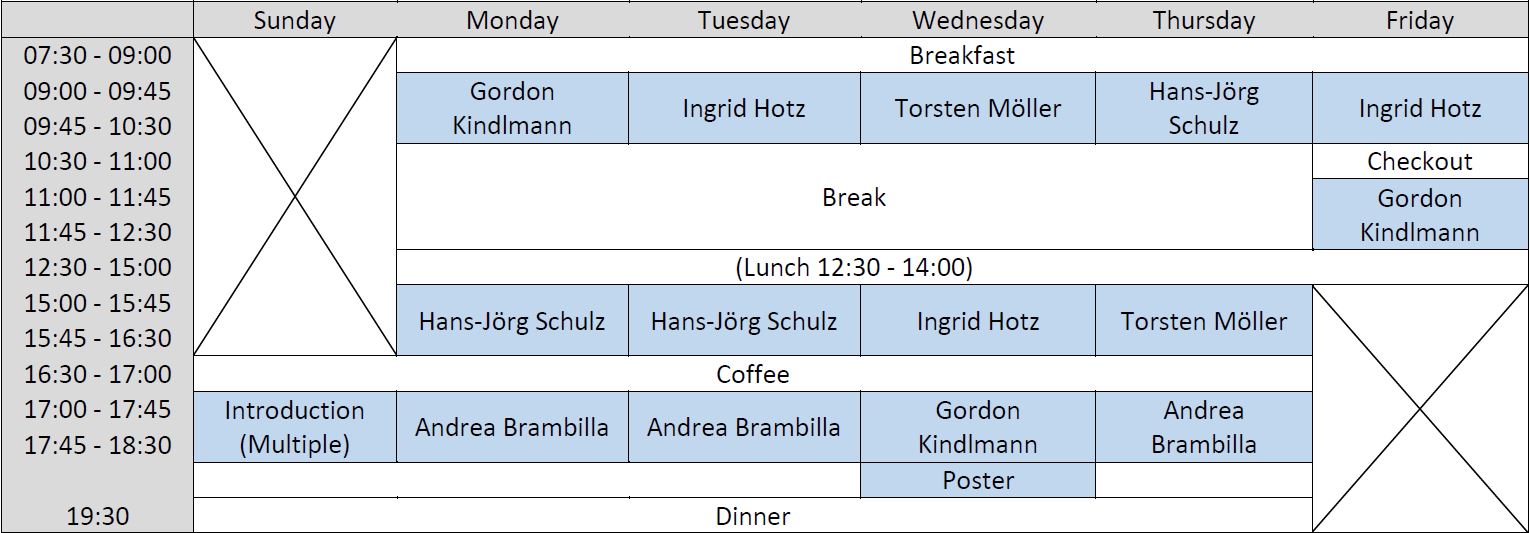
Sunday:
16:30 – 17:00: Coffee
17:00 – 17:15: André R. Brodtkorb: Welcome & Introduction
17:15 – 18:45: Introduction to visualization (Helwig Hauser) (Slides on webpage of Tamara Munzner, Visualization Analysis & Design)
18:45 – 19:15: Scientific Visualization Panel
(Helwig Hauser, Andrea Brambilla slides, Ingrid Hotz slides, Gordon Kindlmann slides, Hans-Jörg Schulz slides)
19:30: Dinner
Monday:
09:00 – 10:30: Gordon Kindlmann: Algebraic Visualization
10:30 – 15:00: Break
15:00 – 16:30: Hans-Jörg Schulz: Information Visualization (ppt, pdf, password is foo!bar where you replace foo with geilo and bar with the year)
16:30 – 17:00: Coffee
17:00 – 18:30: Andrea Brambilla: Paraview tutorial 1
19:30: Dinner
Tuesday:
09:00 – 10:30: Ingrid Hotz:Topology-based visualization 1
10:30 – 15:00: Break
15:00 – 16:30: Hans-Jörg Schulz: Interaction (large ppt, pdf, password is foo!bar where you replace foo with geilo and bar with the year)
16:30 – 17:00: Coffee
17:00 – 18:30: Andrea Brambilla: Paraview tutorial 2
19:30: Dinner
Wednesday:
09:00 – 10:30: Torsten Möller: Visualization tools for decision making 1
10:30 – 15:00: Break
15:00 – 16:30: Ingrid Hotz: Topology-based visualization 2
16:30 – 17:00: Coffee
17:00 – 18:30: Gordon Kindlmann: Diderot
18:30 – 19:15: Poster session
19:30: Dinner
Thursday:
09:00 – 10:30: Hans-Jörg Schulz: Visual analytics (large ppt, pdf, password is foo!bar where you replace foo with geilo and bar with the year)
10:30 – 15:00: Break
15:00 – 16:30: Torsten Möller: Visualization tools for decision making 2
16:30 – 17:00: Coffee
17:00 – 18:30: Andrea Brambilla: Paraview tutorial 3
19:30: Dinner
Friday:
09:00 – 10:30: Ingrid Hotz: Tensor visualization
10:30 – 11:00: Break (Remember check out by 11:00)
11:15 – 12:45: Gordon Kindlmann: Space-scale particles
13:00 – 14:30: Lunch
15:19 Train to Oslo
15:41 Train to Bergen
Software and material
Diderot:
Install Diderot for the wednesday lecture by Gordon Kindlmann. Follow instructions here. (Please note that this is aimed at OSX / Linux users)
Paraview tutorial:
Download sample data (36 MB)
Install Paraview 4.4 from http://www.paraview.org/download/
Lecturers
Andrea Brambilla
Andrea Brambilla is Sr. Research Engineer at GexCon AS. He received his PhD degree from the University of Bergen in 2014, on the topic of illustrative flow visualization. His research interests include vector and tensor field visualization, computational fluid dynamics and visualization of risk and uncertainty.
Ingrid Hotz
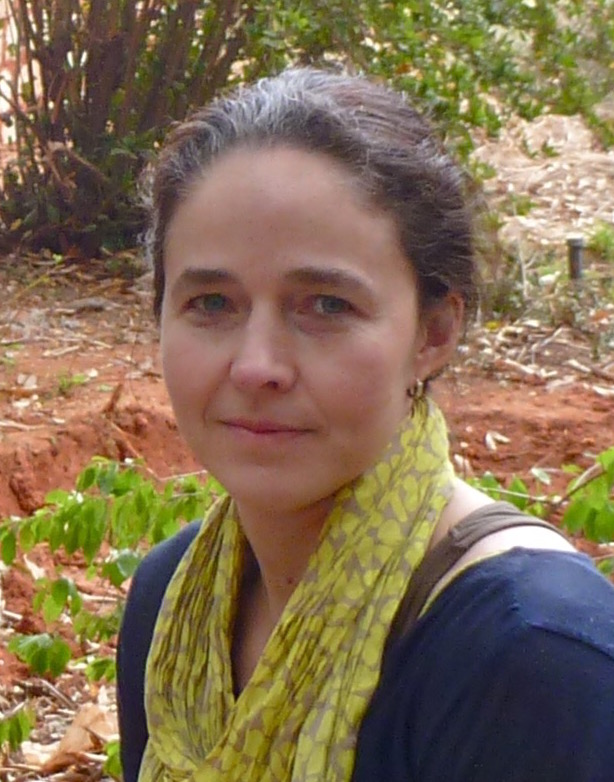
Ingrid Hotz is professor in interactive visualization at Linköping University, Sweden, where she also coordinates the Visualization Community of the Swedish eScience Research Centre. Her research interests include vector and tensor field visualization.
Gordon Kindlmann
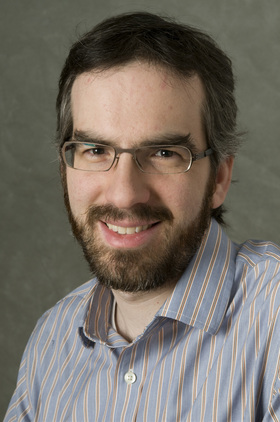
Gordon Kindlmann is Assistant Professor at the Unviersity of Chicago, where he researches image analysis and data visualization to improve the computation of imaging-based science. His research interests include informative direct volume renderings, inspired by traditional techniques of edge detection; ways of translating mathematical principles of image processing; and computer vision to practical methods of detecting, measuring, and understanding biological or physical structure in modern imaging data.
Torsten Möller
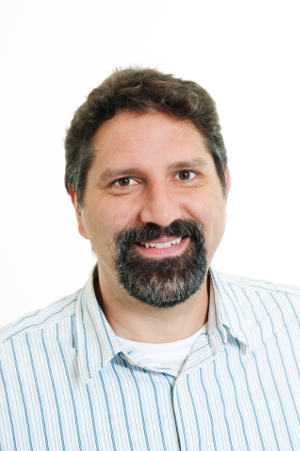
Torsten Möller has been a professor at the University of Vienna, Austria, since 2013, and is the head of the research group of Visualization and Data Analysis. He received his PhD in Computer and Information Science from Ohio State University in 1999, is a member of Eurographics, and a senior member of IEEE and ACM. He has received several awards, and served as the appointed Vice Chair for Publications of the IEEE Visualization and Graphics Technical Committee (VGTC) from 2003 to 2012. His research interests include algorithms and tools for analyzing and displaying data with principles rooted in computer graphics, image processing, visualization and human-computer interaction.
Hans-Jörg Schulz
Hans-Jörg Schulz is Senior Researcher at Fraunhofer, and Associate Researcher at Graz University of Technology. His expertise lies in developing visual and analytical approaches which facilitate the understanding of structured data with an emphasis on graph and hypergraph structures. In his current position at the Fraunhofer Institute for Computer Graphics Research, he also researches structural aspects of data, such as heterogeneous, multiscale, and multilevel data. He frequently applies his research in the domains of biomedicine, climatology, and recently also in the domain of manufacturing and automation, all of which have a high demand for Visual Analytics solutions for structured data.
Topics
The topics of the winter school are found below. Please note that the absracts are subject to change, and will be updated regularly.
Interactive tutorial on Paraview
Lecturer: Andrea Brambilla
Abstract: This will be an interactive tutorial, with exercises, for using ParaView for scientific visualization. ParaView is an open-source software that supports analysis and visualization tasks over large 2D and 3D data sets. By exploiting the features of the Visualization Toolkit (VTK) library, ParaView is able to handle a moltitude of data formats, provides extensive data processing capabilities, and implements a large number of rendering modalities. The tutorial will start by introducing the basic architecture of ParaView and the fundamental concepts required for working with this software. Participants will learn to set up a visualization pipeline and to tune the available rendering techniques. Selected data representations and data processing filters will be presented. The Python scripting capabilities of ParaView will also be discussed, and participants will have the chance to solve several hands-on excercises. The tutorial is mainly targeting beginners, and no previous experience with the application is required. A basic knowledge of Python can be helpful for solving the most advanced excercises.
Visualization in the Computational Sciences
Lecturer: Gordon Kindlmann
Tentative Abstract: This session will show how a range of techniques in different areas of visualization can be understood and evaluated with some common underlying ideas. We will establish a functional vocabulary for talking about what does and doesn't work in a visualization, and because we believe the value of a visualization lies in its practical application, we propose general principles for good visualization design.
We will further show visualization of symmetric second-order tensors in two and three dimensions using superquadric glyphs, gracefully and unambiguously depicting any combination of positive and negative eigenvalues. We will cover example uses including stress tensors from mechanics, geometry tensors and Hessians from image analysis, and rate-of-deformation tensors in computational fluid dynamics.
We will also introduce and demonstrate Diderot: a Domain-Specific Language for Portable Parallel Scientific Visualization and Image Analysis. The basic idea is to start with Taylor's theorem and Newton's method of root-finding, and to use that to show why we shade isosurfaces with the gradient of the function; how Levoy's 2D transfer function is derived from Newton's method; how generalizations of the same approach are used to visualize extremal features including ridges/valleys and maxima/minima; and how extremal features of scalar attributes of vector and tensor fields are used to show their structure.
Finally, we will present Scale-Space Particles, and why scale-space matters for visualizing and extracting features. We will start by reviewing some of the related knowledge from computer vision and statistics, and continue by showing how it can be used for biomedical applications, such as extracting structure from chest CT scans. This will be based on the Teem software, which is released under an open source lisence.
Relevant Links
- An Algebraic Process for Visualization Design
- Superquadric Glyphs for Symmetric Second-Order Tensors
- Diderot: a Domain-Specific Language for Portable Parallel Scientific Visualization and Image Analysis
- Sampling and Visualizing Creases with Scale-Space Particles
Feature based methods in scientific visualization
Lecturer: Ingrid Hotz
Abstract: With the increasing complexity of data, efficient methods for filtering and abstraction of the data become more and more important. Feature based methods, which try to extract interesting structures or patterns form the data, are one way to approach this challenge. In this lecture we will discuss different concepts of feature extraction in scientific applications. Thereby we will focus on methods motivated by examples from fluid mechanics and mechanical engineering. In detail we will cover the following topics:
Topological data analysis: The use of topological methods for visualization has lead to many very powerful techniques for feature extraction. In this lecture I will give an introduction to basic topological methods for scalar and vector fields. We will discus the use of these methods for some examples in the field of fluid mechanics.
Tensor field visualization for mechanical engineering: In comparison to vector field visualization the state of the art in tensor field visualization is much less advanced. The notion of features is less clear and thus data filtering relies more on exploration. In this part of the lecture we will start with an introduction to tensor fields and basic tensor visualization methods. Then we will discuss one specific application to highlight related challenges.
Visual Analytics and Interaction
Lecturer: Hans-Jörg Schulz
Human-Computer Interaction: As visual representation realizes the communication of data and computational results from the computer to the user, so does interaction realize the communication of the users' intentions and tasks to the computer. Only in concert, visual representation and interaction form the bidirectional communication between computer and user that is called visualization. While the visual communication channel from the computer to the user has a high throughput, the channels facilitated by interaction (mouse clicks, key presses, touch gestures) are rather limited. This imbalance is the origin of many of the scientific questions in interaction research for visualizations. This lecture will provide an overview over interaction and its research challenges based on the model of communication. For those challenges most relevant to visualization, it will then discuss exemplary solution approaches and illustrate them with software demos and videos.
Visual Analytics: Visual Analytics is the science of analytical reasoning supported by interactive visual interfaces. To this end, it realizes a tight integration of algorithmic computation and interactive visual exploration. This lets the computer and the human user each do what they can do best, thereby achieving faster and deeper insight into data than any discipline could by itself. Well, at least in theory... Achieving such a tight integration with a fluid back and forth between computer and user poses a tremendous computational, visual, and ergonomical challenge in practice. After covering the fundamentals of Visual Analytics, this lecture will look specifically at these challenges,
present current State-of-the-Art approaches to address them, and exemplify them by showcasing Visual Analytics systems.
Information Visualization
Information visualization is often defined as visualization of data without a given spatial reference, as opposed to scientific visualization which depicts data that has such a spatial reference. Yet this distinction becomes hard to uphold as nowadays already 60%-80% of all data is geospatially referenced – including document collections and network data, whose depiction is usually considered to be part of Information Visualization. Reason enough to have a look into this field of visualization to better understand the particularities of depicting data classes, such as text, hierarchies and networks, and categorical data, as well as data with additional properties, such as multi-scale, multi-level, or multi-dimensional data. This lecture will give a short introduction into the field of information visualization, before presenting visualization solutions for the key data classes and data properties that are most often encountered in the wild.
Visual Tools for Decision Making
Lecturer: Torsten Möller
Abstract: This session will highlight the power of visual supported analysis of computational simulations. I will first give a detailed example from our own work -- a tool for fisheries managers (Vismon). Based on an analysis of numerous other tools we have created as well as a review of 21 different application scenarios, I will make the case that visual support greatly facilitates the understanding of these complex systems leading to faster workflows and a better decision process. Some of the challenges to be tackled include the communication of uncertainty as well as the consideration of multiple objectives.
Posters
Visualization of magnetically induced current densities in molecules, Heike Fliegl, Centre for Theoretical and Computational Chemistry (CTCC), University of Oslo.
Applied Topology Optimization for Large Scale Problems, Said Zeidan, Department of Mechanical Engineering, Technical University of Denmark.
Interhemispheric climate variability in a pre-industrial control simulation of CCSM4, Jonathan Rheinlænder, Department of Earth Science, Bjerknes Centre, ice2ice, and Prof. Markus Jochum.
Patient Specific Modeling of Cardiac Mechanics, Henrik Nicolay Finsberg, Simula Research Laboratory.
Visualization methods for fracture flow problems, Piotr Olkiewicz, Polish Geological Institute - NRI.
Kalkulo Expert Slutions (poster 1, poster 2), Yvon Halbwachs, Kalkulo AS.
Scalable Heterogeneous CPU-GPU Computations for Unstructured Tetrahedral Meshes, Johannes Langguth, Simula.
Visualizing and comparing In-Situ, Model and EO data, Aleksander Vines, Nansen Environmental and Remote Sensing Center.
Cloud Lightning project, Anne C. Elster, NTNU.
NTNU HPC-Lab GPU-Based Snow Simulator, Anne C. Elster, Inge Halsaune and Thomas Schmid.
Predictive Statistical Analysis of Cardiac Structural and Functional Remodelling, Kristin Mcleod, Simula research laboratory.
Participants
| Name | Affiliation | Poster | |
|---|---|---|---|
| Martin Sandve Alnæs | Simula | ||
| Jo Asplin | Norwegian Meteorological Institute | ||
| Trygve Bærland | UiO | ||
| Åsmund Birkeland | University of Bergen | ||
| Petter E. Bjørstad | University of Bergen | ||
| Andrea Brambilla | GexCon AS | ||
| Andre R Brodtkorb | SINTEF | ||
| Stefan Bruckner | University of Bergen | ||
| Jan Byška | University of Bergen | ||
| Anne C. Elster | NTNU | Yes | |
| Solveig Engebretsen | University of Oslo | ||
| Chaoran Fan | University of Bergen | ||
| Henrik Nicolay Finsberg | Simula Research Laboratory | Yes | |
| Heike Fliegl | University of Oslo, CTCC | Yes | |
| Kathrine Frey Frøslie | Oslo University Hospital | ||
| Alessio Fumagalli | University of Bergen | ||
| Deniz Gezgin | University of Bergen | ||
| Gareth Benjamin Gillard | NMBU | ||
| Yvon Halbwachs | Kalkulo AS | Yes | |
| Inge Edward Halsaunet | NTNU | Yes | |
| Helwig Hauser | University of Bergen | ||
| Karl Erik Holter | University of Oslo | ||
| Ingrid Hotz | Linköping University | ||
| Kaibo Hu | University of Oslo | ||
| Jørn Skaarud Karlsen | Kalkulo AS / Simula | ||
| Gordon Kindlmann | University of Chicago | ||
| Runhild Aae Klausen | Norwegian Defence Research Establishment (FFI) | ||
| Ivan Kolesar | University of Bergen | ||
| Michael Kraetzschmar | Flensburg University of Applied Sciences | ||
| Johannes Langguth | Simula Research Laboratory | Yes | |
| Jeonghun John Lee | University of Oslo | ||
| Andreas Johnsen Lind | University of Bergen | ||
| Kristin Mcleod | Simula research laboratory | Yes | |
| Torsten Möller | University of Vienna | ||
| Solveig Næss | University of Oslo | ||
| Piotr Olkiewicz | Polish Geological Institute | Yes | |
| Andreas Nygård Osnes | Universitetssenteret på Kjeller | ||
| Eleonora Piersanti | Simula Research Laboratory | ||
| Andreas Plach | University of Bergen | ||
| Antoine Pultier | SINTEF | ||
| Jonathan Rheinlænder | Bjerknes Centre, ice2ice | Yes | |
| Martin Lilleeng Sætra | Norwegian Meteorological Institute | ||
| Espen Sande | University of Oslo | ||
| Hans-Jörg Schulz | University of Rostock | ||
| Tore Schweder | University of Oslo | ||
| Aklilu Toma Shamenna | Hawassa University | ||
| Sergej Stoppel | University of Bergen | ||
| Nigatu Degu Terye | Hawassa University | Yes | |
| Terje Urnes | University of Bergen | ||
| Lars Magnus Valnes | University of Oslo | ||
| Aleksander Vines | Nansen Environmental and Remote Sensing Center | Yes | |
| Said Zeidan | Technical University of Denmark | N/A | Yes |
| Changgong Zhang | Delft University of Technology |
The 2026 Geilo Winter School is funded by the Norwegian AI Cloud project.