|
Harmonic Upscaling
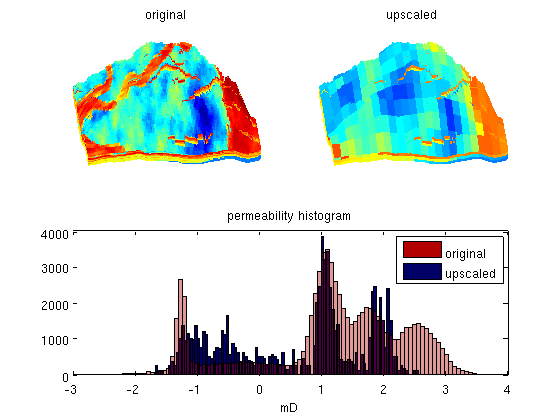
In this example, we will perform a simple harmonic permeability upscaling on a model from the project "Sensitivity Analysis of the Impact of Geological Uncertainties on Production Forecasting in Clastic Hydrocarbon Reservoirs" (SAIGUP). The model has faults, inactive cells, and disconnected components, but no pinch-out. To this end, we form an overlying coarse grid by partitioning the fine-grid uniformly in logical Cartesian space and then use a set of relatively simple calls to 'accumarray' to perform the upscaling. ContentsLoad the required modulestry require upscaling coarsegrid catch %#ok<CTCH> mrstModule add upscaling coarsegrid end Load and process dataWe assume that the data has been downloaded and placed in the appropriate data directory under the MRST root directory. try grdecl = readGRDECL(fullfile(ROOTDIR, 'examples', 'data', ... 'SAIGUP', 'SAIGUP.GRDECL')); grdecl = convertInputUnits(grdecl, getUnitSystem('METRIC')); G = processGRDECL(grdecl); G = computeGeometry(G); rock = grdecl2Rock(grdecl, G.cells.indexMap); catch me error('SAIGUP model data is not available.') end Upscale modelUpscale the model by a factor 5x5x5 using a simple harmonic average for the permeability and arithmetic average for the porosity. (This demonstrates the power of the accumarray call..) w = G.cells.volumes; p = partitionUI(G, G.cartDims./[5 5 5]); for i=1:size(rock.perm,2) K = accumarray(p,w./rock.perm(:,i))./accumarray(p,w); crock.perm(:,i) = 1./K; end crock.poro = accumarray(p, rock.poro.*w)./accumarray(p,w); Visualize resultAs expected, using such a naive upscaling will move the permeability values towards the centre of their fine-scale spectre. clf
pargs = {'EdgeColor','none'};
subplot(2,2,1)
plotCellData(G,log10(rock.perm(:,1)),pargs{:});
view(-95,40); axis tight off; cx = caxis; title('original');
subplot(2,2,2)
plotCellData(G, log10(crock.perm(p,1)), pargs{:});
set(gca,'zdir','reverse');
view(-95,40); axis tight off; caxis(cx); title('upscaled');
subplot(2,2,3:4)
hist(log10(convertTo(rock.perm(:,1),milli*darcy)), 100);
hold on
hist(log10(convertTo(crock.perm(p,1),milli*darcy)), 100);
hold off
h=get(gca,'Children');
set(h(1),'FaceColor',[0 0 0.4])
set(h(2),'FaceColor',[0.7 0 0],'FaceAlpha',.4)
legend('original','upscaled');
title('permeability histogram'); xlabel('mD');
|