MRSTlogo_web_banner_light_thinner_Epi.png

Sleipner Injection: Matching Observed Plume Migration
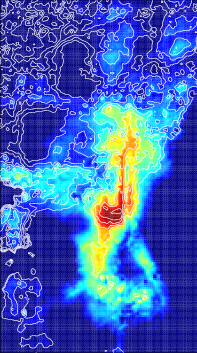
The example shows how VE simulation models from MRST-co2lab was used to perform a sensitivity study and adjust the model parameters of a Sleipner benchmark model so that it better matched observed plume outlines.

Sleipner is a natural gas field located in the North Sea and is the first offshore project for carbon capture and storage. Since 1996, more than 10 million tonnes of CO2 have been injected into the Utsira formation, 200 m underneath the Sleipner gas field. The injection has been subject to a large number of studies; the figure to the right, for instance, shows a seismic image of the CO2 distribution in 2003 in the upper layer.

Herein, we consider a model made by Statoil to study the CO2 in the upper layer and use the VE method implemented in MRST to study the physical assumption in the mode. Using a VE model reduces simulation times by at least one order of magnitude; runtimes for the simulations shown below were typically 2-10 minutes in our (nonoptimized) MRST code.

The figure below shows a comparison of simulations using the original data, and simulations where we have increased the permeability by a factor three, decreased the porosity by a factor 0.6, and decreased the density by a factor 2/3. The result is a significantly better match with the seismic data.

Reference (comparison of MRST with 3D and VE simulations in Eclipse):


Seismic image of the CO2 in the top layer. From Chadwick et al. GHGT9.

Year 7, original data, 240x400

Year 30, original data, 120x200

Year 7, modified data, 240x400

Year 30, modified data, 120x200

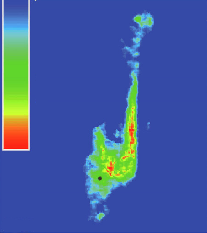
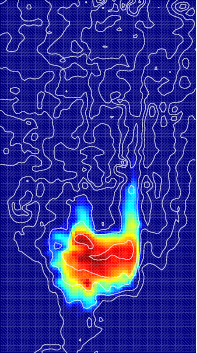
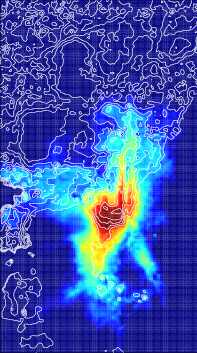
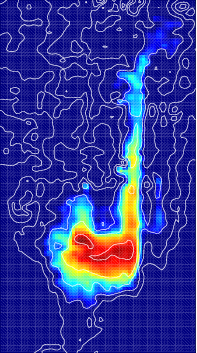
Simulations of CO2 in the top layer of the Utsira formation using the original data (leftmost plots) and modified data (rightmost plots). When simulating only the first 7-year period, we have refined the grid by a factor two in each direction.


Published October 26, 2010