MRSTlogo_web_banner_light_thinner_Epi.png

Utsira: large-scale storage scenario
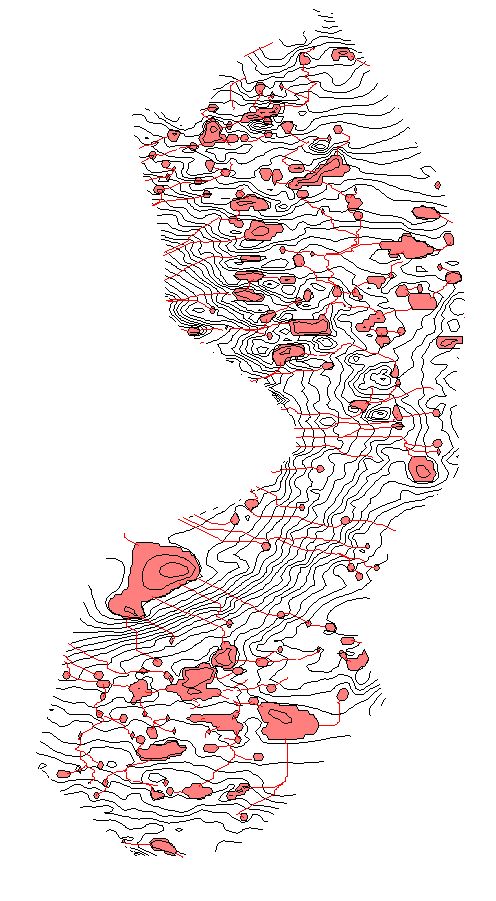
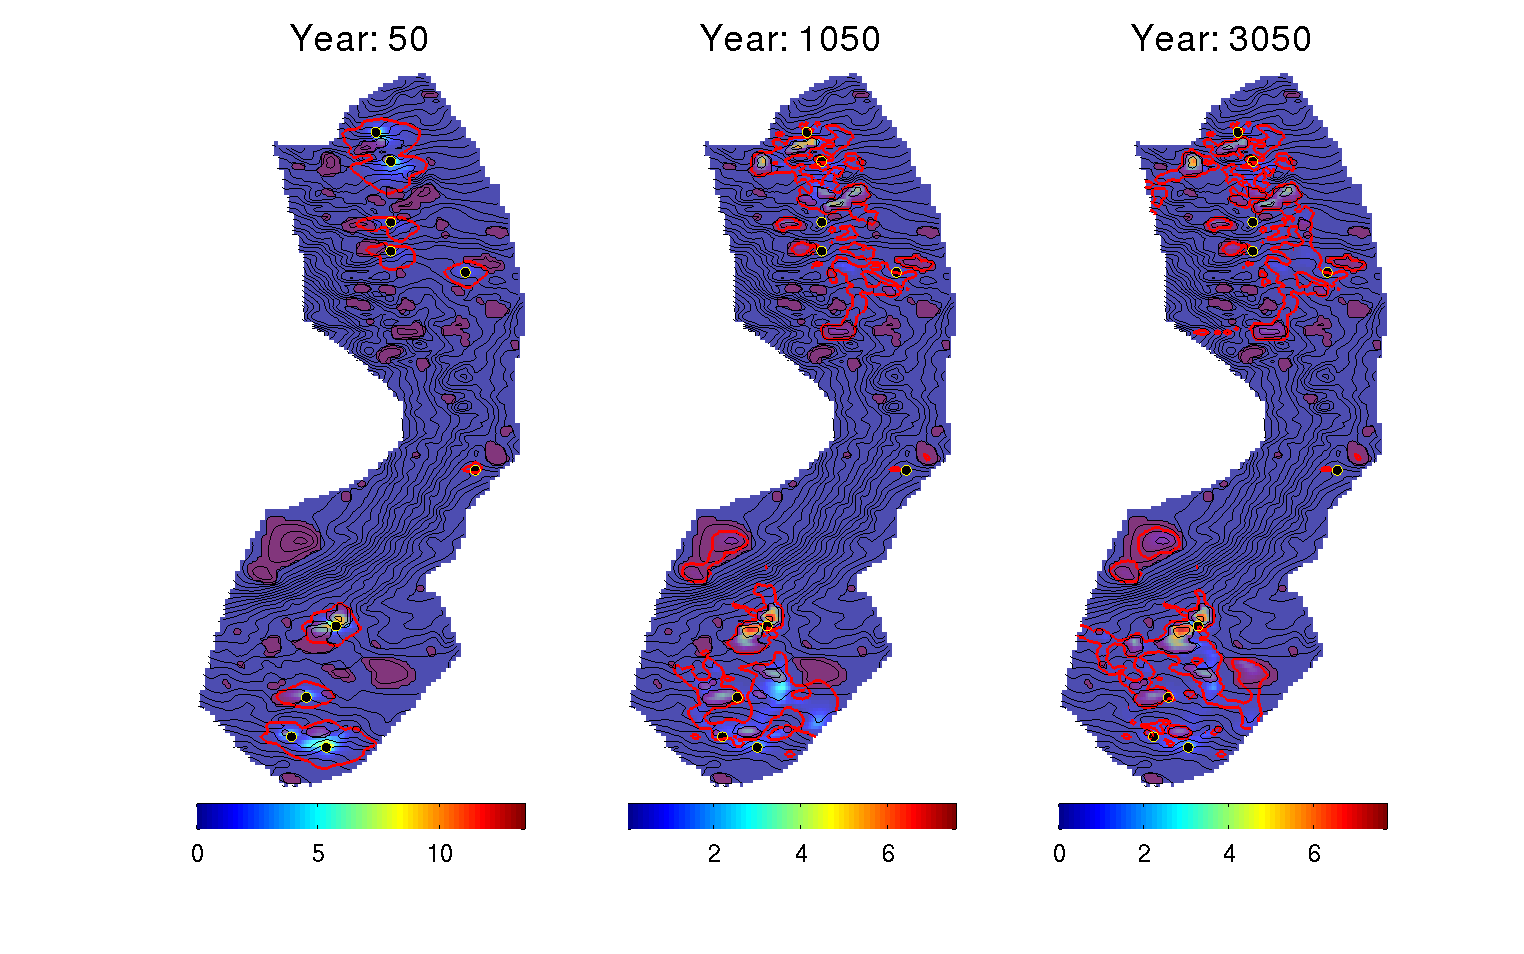
The Utsira Formation is a large saline aquifer covering some 26.000 square kilometers off the western coast of Norway.  It consists of a more than hundred meter thick column of high-permeability sand located at depths ranging from 300-1400 m below sea level.  It is overlaid by a layer of thick, low-permeability shale, which acts as an effective barrier against upward migration of CO2 stored in the formation. CO2 storage operations into the Utsira Formation started in 1996.  Since then, approximately one megatonne of CO2 has been injected per year into the Sleipner site in the southern part of the aquifer.  So far, no leakage has been detected. 

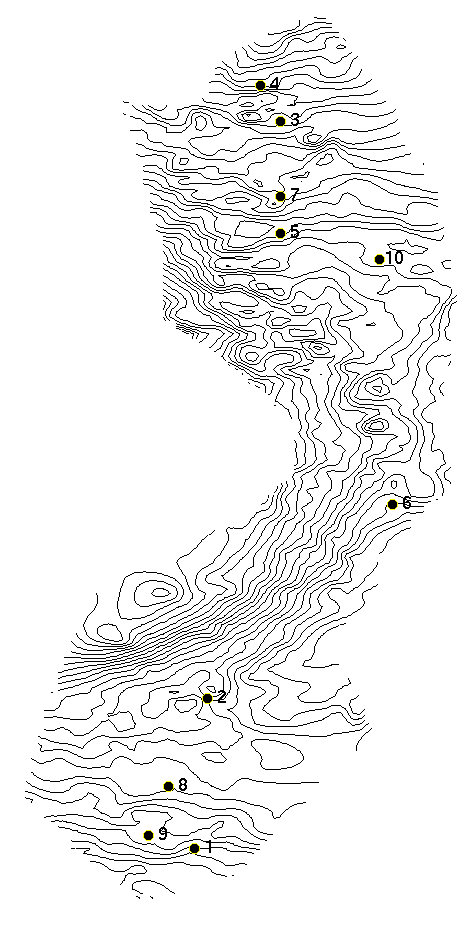
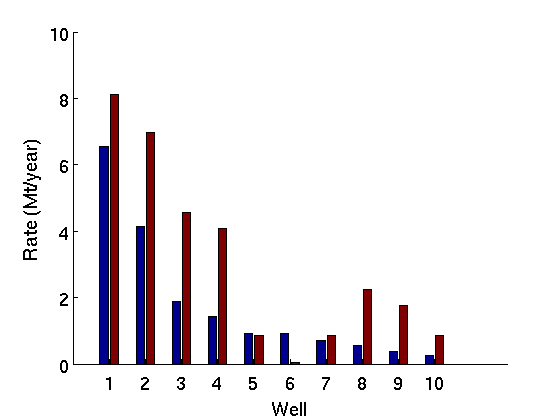
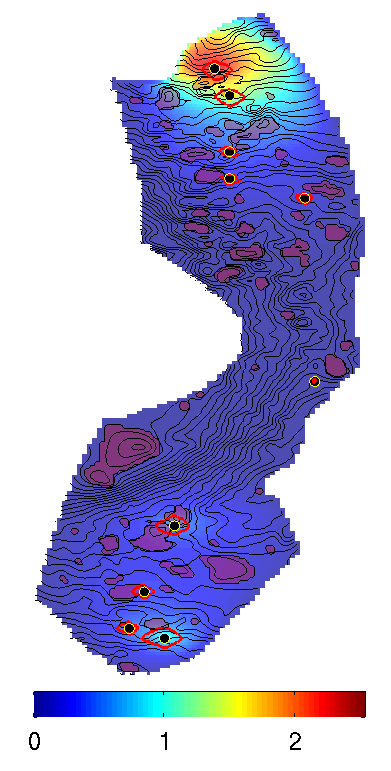
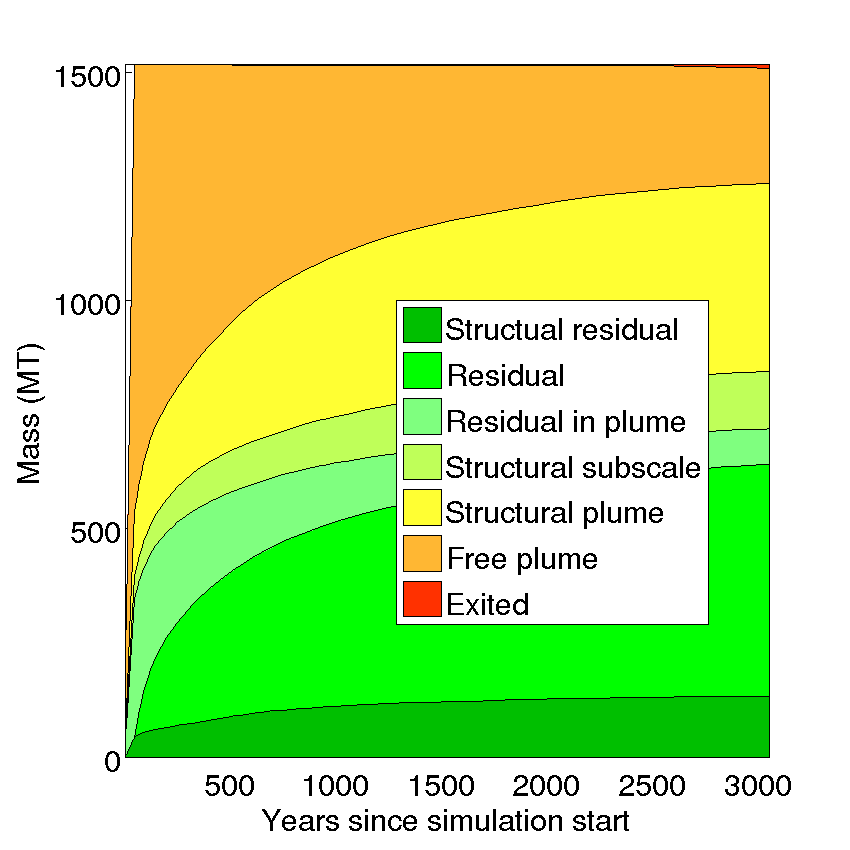
While the Sleipner operation is an important example of CCS in practice, it is not large enough to play any significant role in the context of European emissions reductions.  Below, we demonstrate how we can use the functionality of the Numerical CO2 Laboratory to design and assess an 'optimal' large-scale CO2 storage scenario for the Utsira Formation.  In the simulated scenario, more than 1.5 gigatonnes of CO2 is ultimately injected and safely contained within the formation.

A key assumption in this study is that the aquifer is completely open, with free flow of fluids across its boundaries.  As such, the limiting factor will not be pressure buildup, but the ability of the aquifer to retain injected CO2 in the long run.  The total trapping capacity of Utsira is estimated here.

Structural traps and spill path system defined by the Utsira caprock (click on the image for a larger version).

Location of the ten injector sites chosen by the algorithm (click on the image for a larger version).

Placement of wells

  • We consider an injection scenario with ten separate injection sites.
  • Injection sites are algorithmically chosen in order to maximise the amount of structural trapping capacity reachable by gravity-driven migration from the injection points.
  • The figure on the left below presents a map of all structural traps and spill paths identified in the Utsira caprock, using the spill-point analysis tool of the Numerical CO2 Laboratory.
  • The figure on the right shows the locations of the chosen injection sites, numbered by order chosen (which is also the order of importance in terms of structural capacity covered).

Choosing optimal injection rates

  • In this simplified scenario, the injection rate for each well remains constant for the whole 50 year injection operation.
  • In a first step, well rates are set such that each well injects exactly the amount of CO2 necessary to fill up the structural traps that it can reach.  These rates are shown as blue bars on the right diagram.
  • Recognizing the fact that not all the injected CO2 will reach the targeted structural traps due to the effect of other trapping mechanisms, well rates are further adjusted in a second step, using an nonlinear optimization algorithm whose objective is to maximise injected CO2 while minimizing eventual leakage across aquifer boundaries.
  • The well rates obtained in this second step are indicated by red bars on the right diagram.  As can be seen, most rates have been adjusted significantly upwards by the algorithm.  An exception is well 6, which has been practically shut off due to high leakage risk.

Result of injection and migration study

  • Using the chosen setup for injection sites and well rates, we simulate 50 years of injection followed by 3000 years of migration.
  • For this purpose, we take advantage of the advanced vertical-equilibrium modeling capabilities provided by the Numerical CO2 Laboratory.  This includes modeling of residual saturation, variable CO2 density and structural subscale trapping (ie. structural trapping not explicitly captured by the coarse grid).  Modeling of dissolution is also possible. 
  • Numerically, the simulation is based on a fully-implicit formulation, implemented using automatic differentiation.
  • The figure on the left below shows the trapping state of the injected CO2 over the course of the injection and migration period.
  • The figure on the right below shows snapshots of the CO2 plumes in the aquifer for selected timesteps, corresponding to:
    • End of injection (left)
    • After 1000 years of migration (middle)
    • After 3000 years of migration (right)
  • In total, more than 1.5 gigatonnes of CO2 were injected and stored in this scenario.
  • To verify that the induced overpressure did not exceed unacceptable limits during the course of the injection operation, we inspect the maximum overpressure values reached.
  • The result is shown on the figure at the right (unit: MPa).  The maximum overpressure (2.53 MPa) was reached for an injection site in the north, at the deep end of the aquifer.
  • This overpressure should be well below the Utsira overburden pressure, which can be estimated to range between 4.8 and 23 MPa depending on depth, and assuming a constant lithostatic gradient of 17 MPa/1000 m.
 

Diagram showing injection rates for each of the 10 wells, before (blue) and after (red) nonlinear optimization (click on the image for a larger version).

Maximum induced overpressure resulting from injection (click on image for a larger version).

Trapping distribution of injected CO2 as a function of time for the simulated scenario (click on the image for a larger version).


Snapshot of the simulated aquifer domain, for selected  timesteps (click on the image for a larger version).

Published October 20, 2014