
|
Matching the reported storage capacities of regions identified in the Hammerfest Basin
Here, we use MRST-co2lab's spill-point analysis tool to identify the structural traps in the top formation of the Hammerfest Basin. We then compare these identified traps to the Norwegian Petroleum Directorate's (NPD) storage capacity estimates. The outline of the traps identified by our spill-point analysis tool match quite well to those shown in NPD's CO2 Storage Atlas [1]. Discrepancies between pore volumes are attributed to the difference in the approach used to determine spill-point depth.
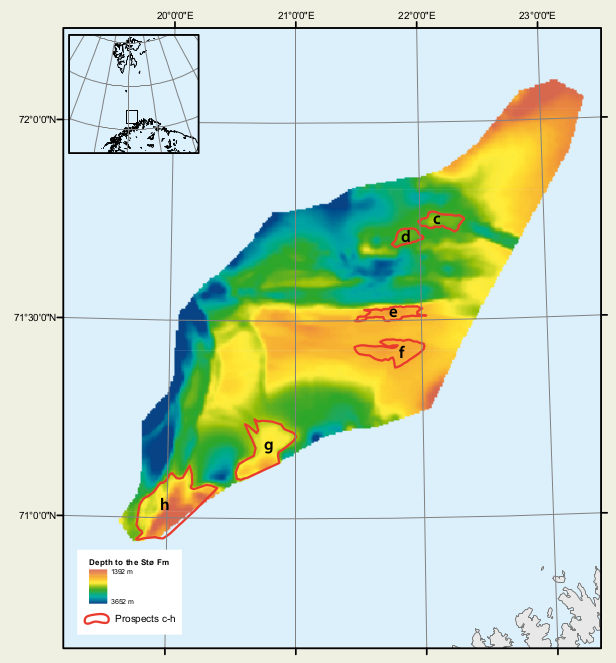
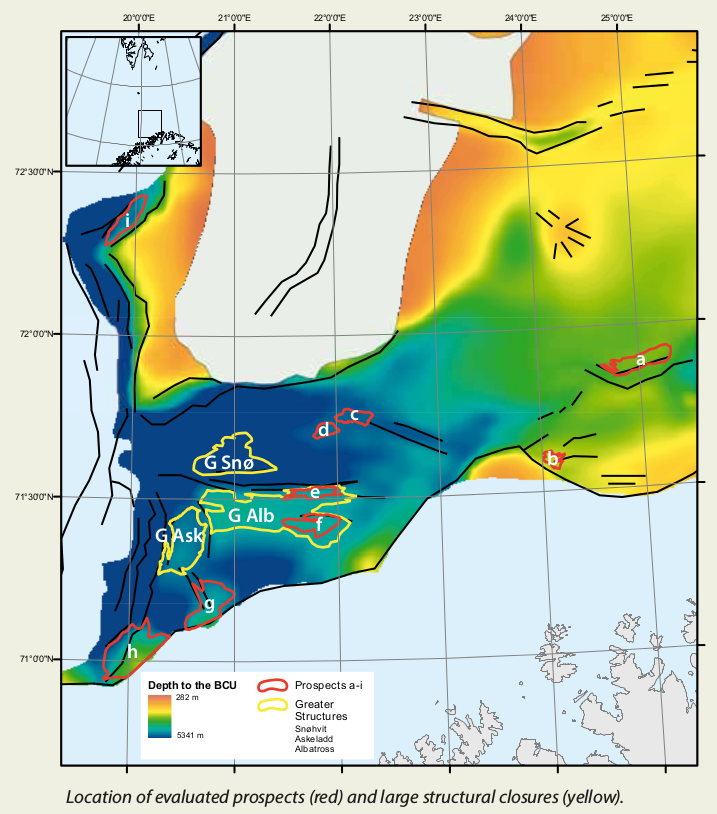
Hammerfest's identified trap regions and their capacitiesThe NPD [1] discusses 6 prospective structural traps in the top formation of the Hammerfest Basin Aquifer, named Prospects C, D, E, F, G, and H. Additionally, three greater structural closures have been identified, named Greater Snøhvit, Askeladd, and Albatross. These structures are ideal to study since it has been reported that they are capable of retaining CO2 and that leakage is unlikely to occur. Details of the prospects and greater structural closures can be found on pages 141-142, and 144 of [1]. Figure 1 shows the traps identified by NPD in the Stø formation, and Table 1 summarizes their volumetric storage capacity. These volumetric estimates were computed by: MCO2 = Vb * ϕ * NTG * ϱCO2(p,T) * Seff where Vb is the bulk (rock) volume in meters cubed, ϕ is the porosity, NTG is the net-to-gross value representing the fraction of bulk volume which is considered as reservoir rock, ϱCO2(p,T) is CO2 density at reservoir conditions (pressure, p, and temperature, T), and Seff is the storage efficiency factor. Vb * ϕ * NTG gives the trap's pore volume. The NPD calculated the pore volumes using mapped surfaces as well as porosity and net-to-gross maps. Also, the NPD gives a short description on how Seff can be determined for a formation, based on characteristics. Values of 0.4 % - 0.8 % were simulated for a closed, homogeneous, and moderately anisotropic (kv/kh=0.1) reservoir, while values of 5 % or more were deemed suitable for an open, highly anisoptropic (kv/kh=0.001) reservoir (chapter 3, page 26 of [1]). Others reference Seff based on the aquifer rock type, such as [2] who reports a value of around 2 % for dolomite, limestone, and sandstone formations. More generally, [3] reports that storage efficiency greatly impacts the estimated storage capacity, and values can be from less than 1 % to greater than 10 %.
Our identified trap regions and their capacities, using MRST-co2lab's
|
||||||||||||||||||||||||||||||||||||||||||||||||
 |
|
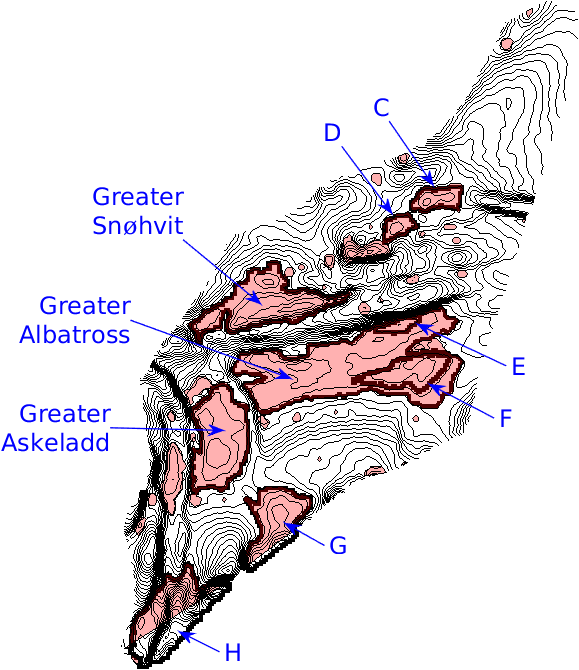
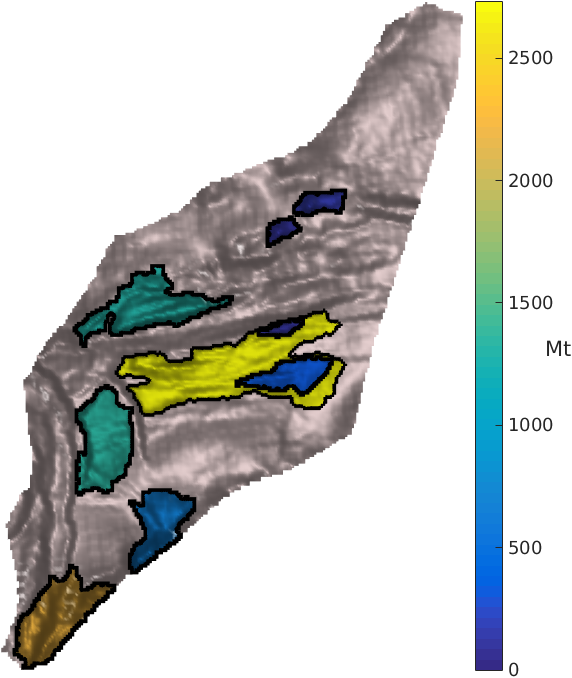
| Figure 2: MRST-co2lab's identified trap regions labelled with the same naming convention as used by NPD (left), and the trap's storage capacity in Mt (right) assuming 100 % storage efficiency. | |
Summary
This work demonstrates the ability of MRST-co2lab's trapAnalysis to detect structural trap regions within the Hammerfest Basin Aquifer. Once the traps were identified, their volumetric CO2 storage capacity was computed using an assumed storage efficiency factor (Seff).
At first glace, our identified trap regions shown in Figure 2 match fairly well to those identified by NPD shown in Figure 1. Also, the pore volumes of our identified prospects C and D are similar to those reported by NPD. However, the pore volumes of the other prospects and the greater structural closures are either significantly greater than or less than NPD's pore volumes. For example, the spill-point we have identified for prospect E is notably shallower than NPD's, and in turn its trap volume is smaller. With respect to prospect H, our trap outline appears to match closely with NPD's trap outline, however NPD reportedly used a "deep spill-point" to compute its trap volume due to the presence of a sealing fault. Thus, the discrepancies we see between our pore volumes to NPD's are either due to the manner in which the spill-points and trap outlines have been identified, or due to the spill-point depth that is used in the trap volume calculations.
References:
1 E. K. Halland, J. Mujezinović, and F. Riis. CO2 Storage Atlas: Norwegian Continental Shelf. Norwegian Petroleum Directorate, Stavanger, 2014.
2 S. Bachu, A. Melnik, and R. Bistran. Approach to Evaluating the CO2 Storage Capacity in Devonian Deep Saline Aquifers for Emissions from Oil Sands Operations in the Athabasca Area, Canada. Energy Procedia, 63:5093-5102, 2014. DOI: http://dx.doi.org/10.1016/j.egypro.2014.11.539
3 J. Gale, J. Abanades, S. Bachu, and C. Jenkins. Special Issue commemorating the 10th year anniversary of the publication of the Intergovernmental Panel on Climate Change Special Report on CO2 Capture and Storage, International Journal of Greenhouse Gas Control, 40:1-5, 2015. DOI: http://dx.doi.org/10.1016/j.ijggc.2015.06.019
4 H. M. Nilsen, K.-A. Lie, O. Møyner, and O. Andersen. Spill-point analysis and structural trapping capacity in saline aquifers using MRST-co2lab. Computers & Geosciences, Vol. 75, pp. 33-43, 2015. DOI: http://dx.doi.org/10.1016/j.cageo.2014.11.002