|
Sleipner grid and property comparison
Vertical-equilibrium modeling was conducted using two variants of the Sleipner benchmark model [1], and using original as well as modified input properties (permeability, porosity, and CO2 density). This modeling work demonstrates that Sleipner's flow-dynamics can be adequately captured using a Darcy-based flow model. Also, our comparison demonstrates that one can achieve an excellent simulated match to the 2008 observed plume outline using one of the grid variants and modified properties.
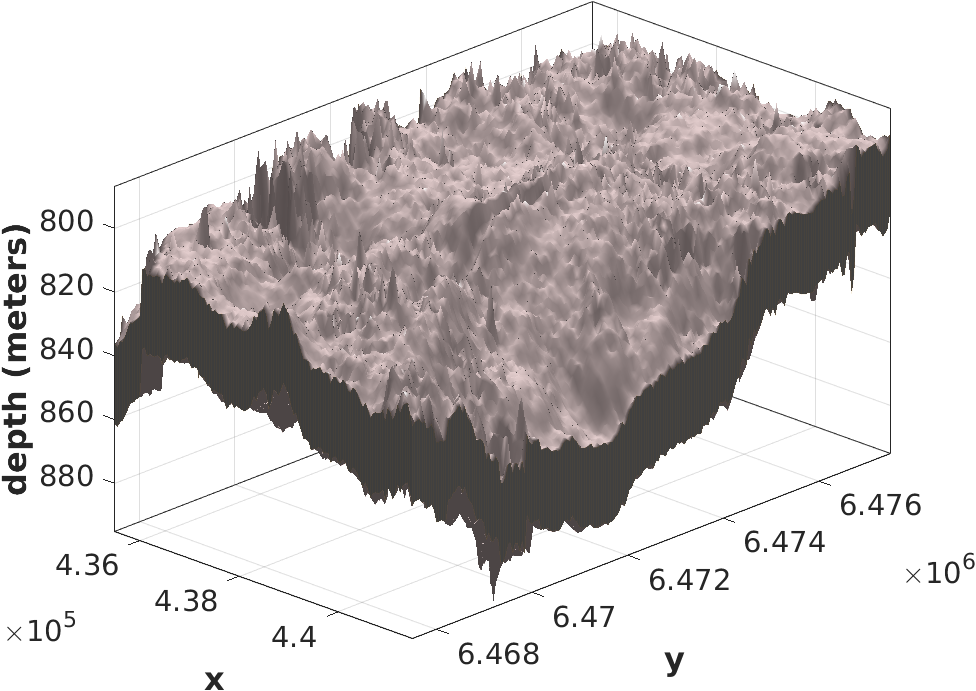
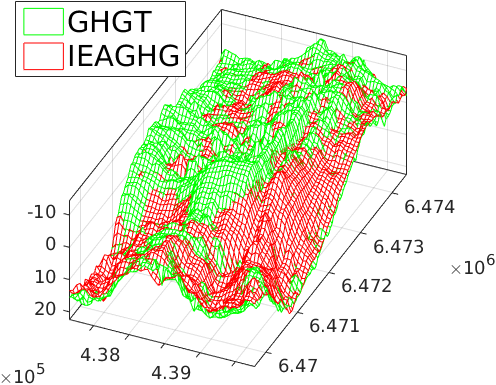
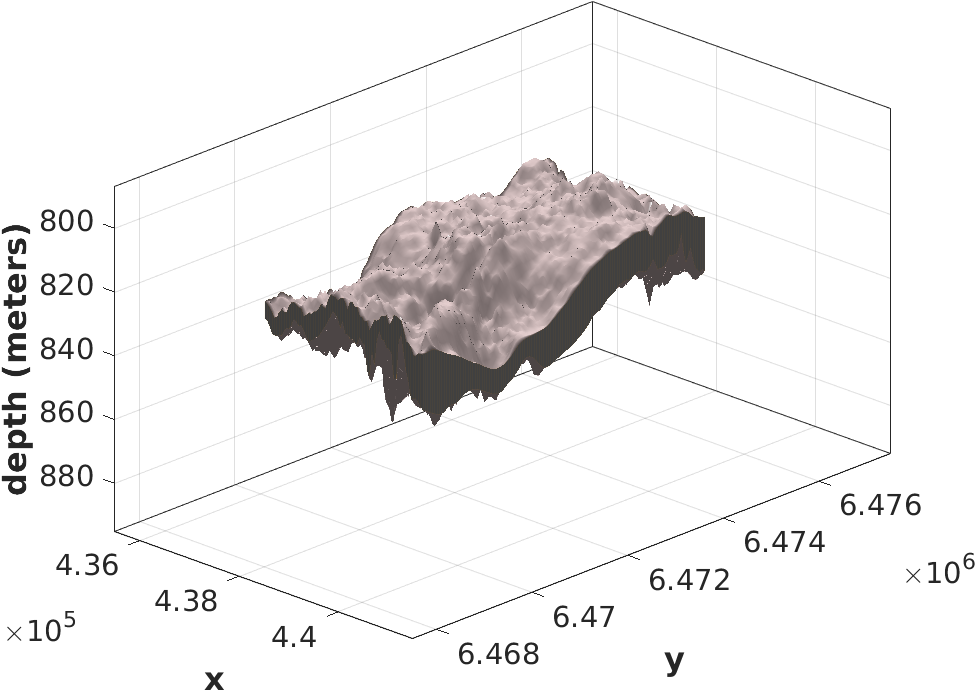
Grid comparisonBuoyancy forces cause CO2 to rise upwards until reaching the caprock, and will fill any structural traps present as it continues to migrate under the sloping caprock. Thus, the simulated migration of the CO2 plume will be strongly influenced by the grid's representation of the caprock. Variants exist between the grids used previously to study the Sleipner injection project. Figure 1 shows the two Sleipner grids we considered, namely:
We keep the same naming convention used in [2], which refer to these grids as GHGT and IEAGHG, respectively.
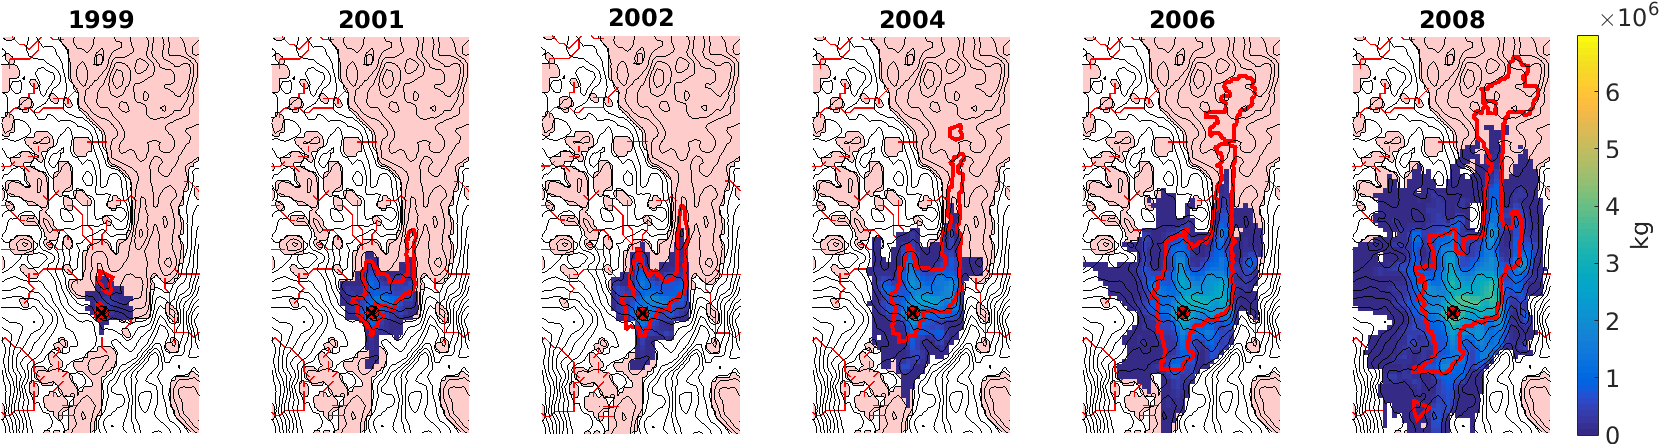
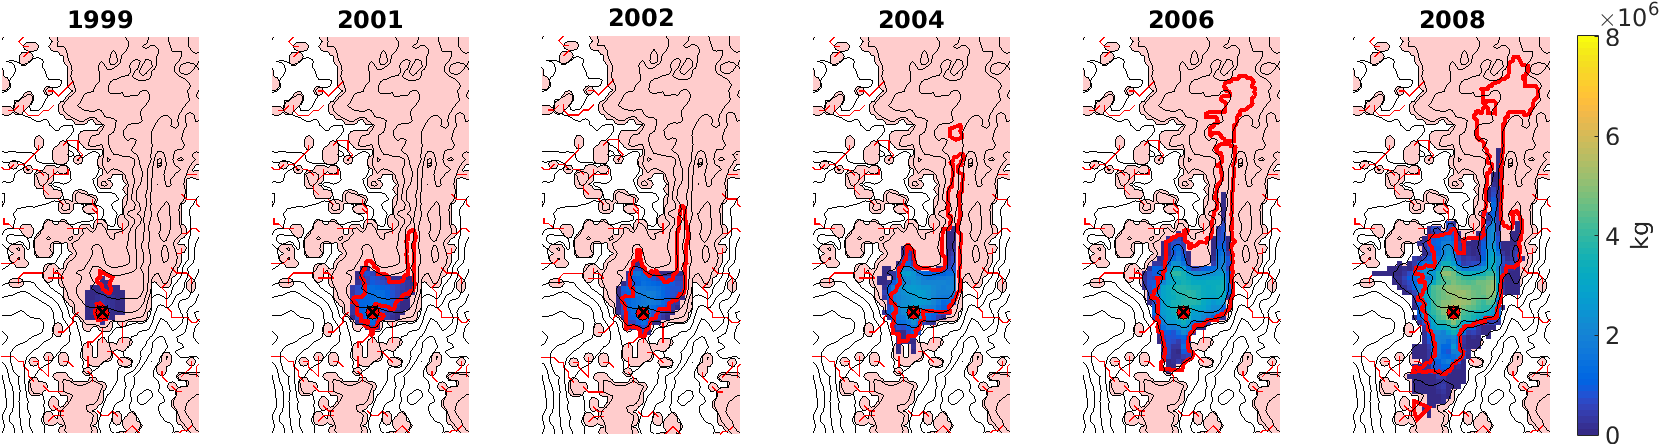
Comparison of the simulated match obtained using different grids and propertiesFigures 2 and 3 illustrate the impact which both the grid and the input properties have on obtaining a simulated match to the observed plume outline (shown in red). Sleipner's original benchmark properties given in [1] include a porosity of 0.3571, a horizontal permeability of 1850 mD, and a CO2 density of 760 km/m3 at reservoir conditions. Our modified properties refer to 0.6, 3, and 2/3 times the original porosity, permeability, and CO2 density, respectively. In Figure 2, modified properties give a slightly better match to the observed plume outline. However, a better simulated match is obtained using the GHGT grid with the original properties as shown in Figure 3, and an excellent simulated match is obtained using with modified properties.
Footnotesa Statoil and the Sleipner Licence are acknowledged for the provision of the Sleipner 2010 Reference dataset. Any conclusions in this webpage concerning the Sleipner field are the author's own opinions and do not necessarily represent the views of Statoil. References
|
|||||||||||||