|
Structural Trapping and Spill-Point Analysis
The most immediately available trapping mechanism is stratigraphic or structural trapping, in which the CO2 migration is blocked by low-permeable rock barriers. In the following, we outline methods that can identify the potential for structural trapping without utilizing temporal information. That is, structural traps can be identified and their volume assessed using geometric analysis of the caprock shape, whereas percolation-invasion type algorithms from basin modeling can be used to approximate how CO2 migrates upward and gradual fills the structural traps.
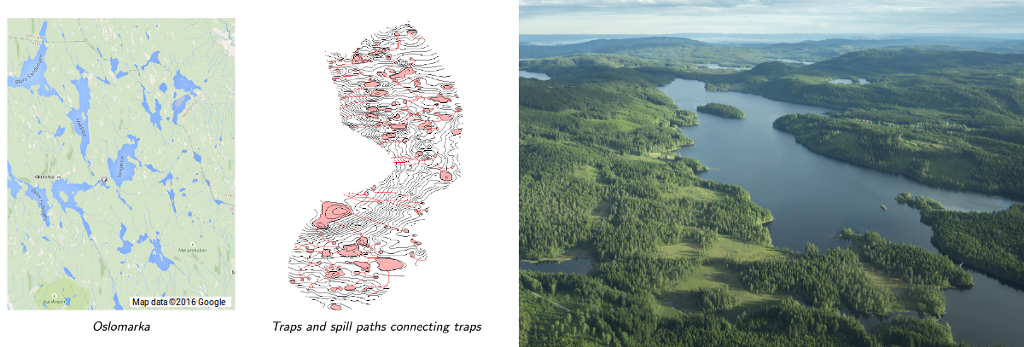
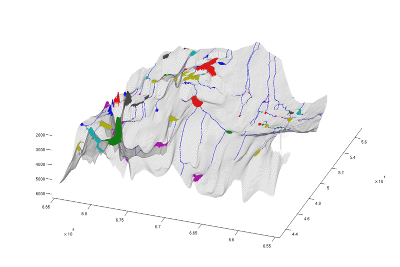
Traps can be formed by a variety of geometrical arrangements of the reservoir rock and the sealing top surface. Structural traps form as a result of changes in the structure of the subsurface. The most common forms are called fold (anticline) traps and fault traps. Fold traps refer to areas in which the reservoir rocks have been pushed into the shape of a dome. Fault traps form when permeable and impermeable rocks are displaced along a fault line. Stratigraphic traps are formed as the result of variations in the thickness, texture, porosity, or lithology of the reservoir rock. Analogy with watershed analysisThe system of structural traps and spill paths that describe how CO2 injected at an infinitesimal rate will trickle upward in the formation has a direct analogy with surface water hydrology and CO2 migration. Imagine that the caprock is turned upside down so that the upslope CO2 migration is replaced by rainwater flowing towards the sea. Then, traps will correspond to lakes and ponds, spill points to river outlets, spill paths to rivers, and spill regions to catchment areas, as illustrated in Figure 1. This analogy may give a more intuitive mental picture of the migration process, from which it is relatively easy to see that just as a detailed simulation is not required to predict where rainfall eventually flows and accumulates, a spill-point analysis can give a good idea of where injected CO2 will end up.
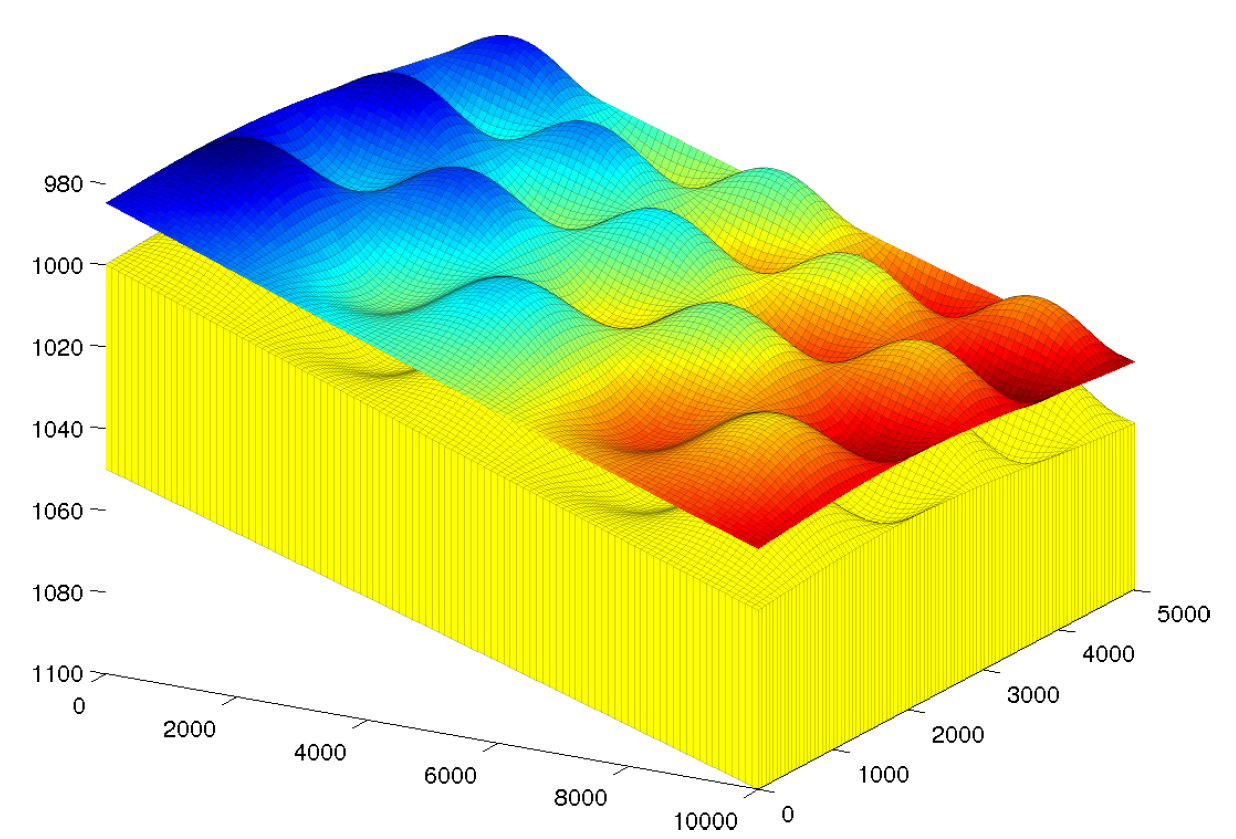
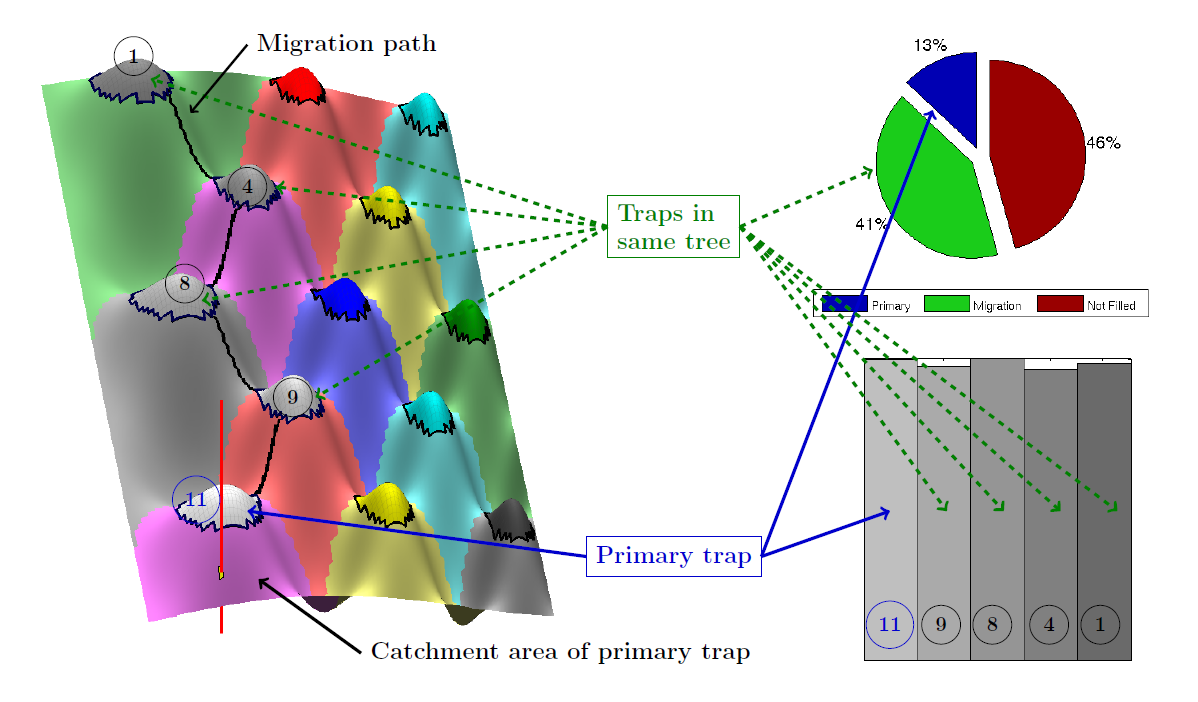
Analysis tools in MRST-co2labTraps, spill points, spill regions (catchment areas), and spill paths can be computed using algorithms that only require information about the surface that separates an aquifer from its overlying caprock (see Figure 2). MRST-co2lab implements several geometrical algorithms that enable the user to identify structural traps in the sealing caprock, as well as algorithms that also use the topology of the top surface to determine spill points, spill regions and spill-paths that connect traps in the upslope direction (see Figure 3). These tools have a low computational cost, but give much information of the migration process. For this reason, we recommend that a study of traps and spill systems is used as starting points for more comprehensive simulation studies.
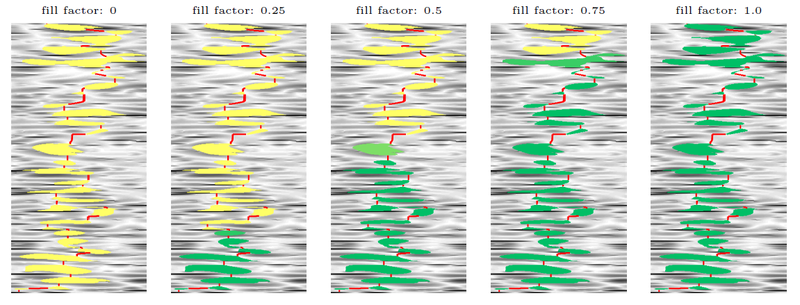
Figure 4 shows an illustration of how CO2 injected at a infinitesimal rate would trickle upward and fill a succession of traps that are connected by spill paths in the upslope direction. This will obviously not give a completely correct picture of a migrating plume, since any plume will have an areal extent that may potentially cover multiple spill paths and also be subject to other trapping mechanisms such as residual and dissolution trapping. But as a first order estimate, a spill-point analysis will give a good idea of where a large fraction of the CO2 may eventually end up.
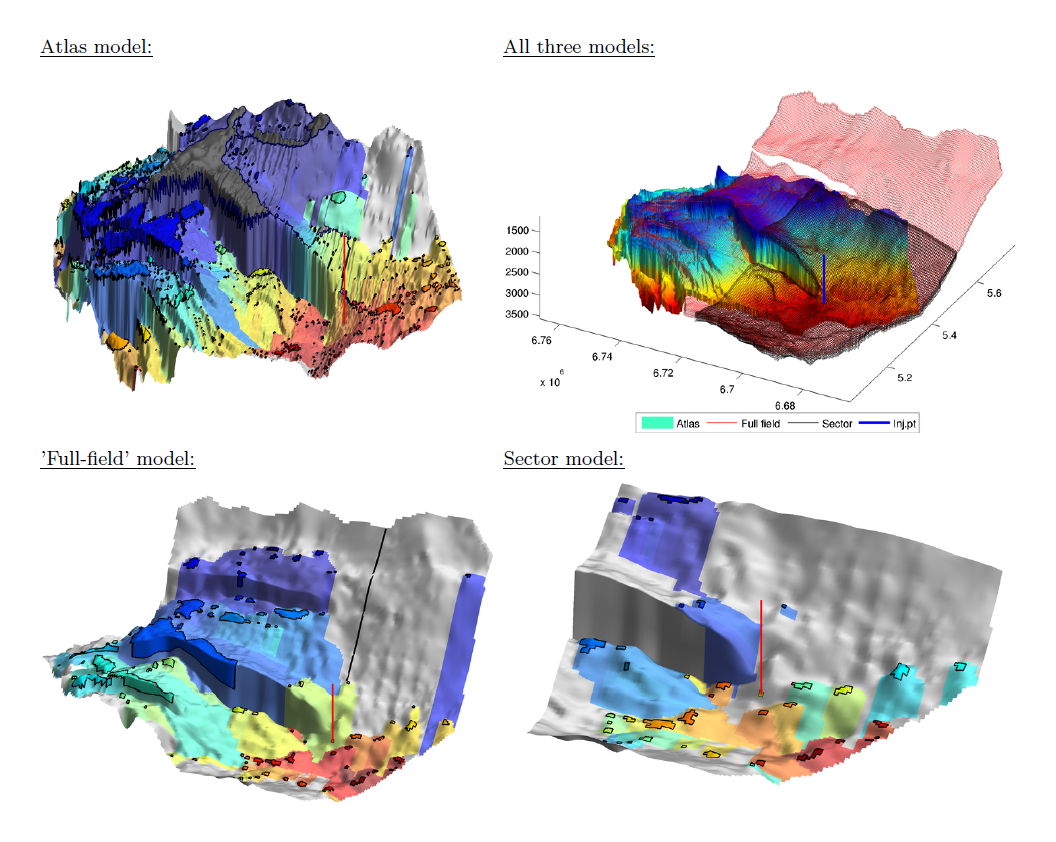
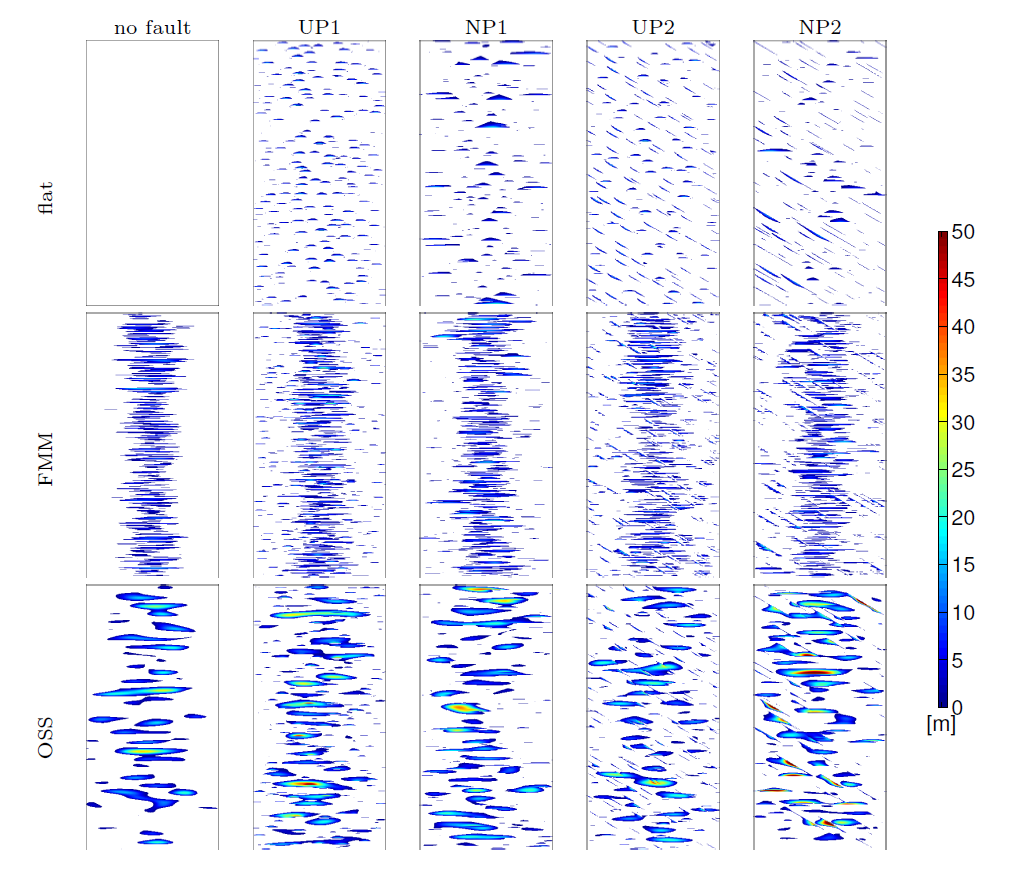
Many studies of large-scale CO2 migration have shown that the top-surface topography is often the primary effect that determines how the direction of the migrating plume. Resolving the topography of the top surface as correctly as possible is therefore utterly important if one wants to reliably forecast the long-term fate of the injected CO2. Figure 5 gives a compelling example for three different models of the Johansen formation. The high-resolution atlas model contains much more details than the low-resolution 'sector' and 'full-field' models that were developed for 3D simulation purposes. Not only do the low-resolution models predict a completely different spill paths, but they also lack a large number of small-scale traps that will tend to retard plume migration. This gives a strong indication that one should not expect that subsequent flow simulations will give comparable results. Figure 6 shows another example where identification of traps along the spill path from a given injection point is used to compare and contrast fifteen different stratigraphic and structural scenarios for the same aquifer system. These structures appear at a sub-seismic resolution and should hence be considered as equiprobable. Their retardation effect, however, is strongly different, but can to a large extent be eluicdated by considering the trap structure.
Tutorials and examplesThe following articles show excepts from the tutorials and examples that are an important part of the Numerical CO2 laboratory:
LiteratureRead more about the workflow and computational methods that can be used to calculate structural trapping in the following papers:
|
|||||||||||||||||||||