
This script uses the multiscale mixed finite-element method to solve a single-phase flow problem driven by a pressure drop from the west to the east side of two 2.5D grids containing a curved fault:
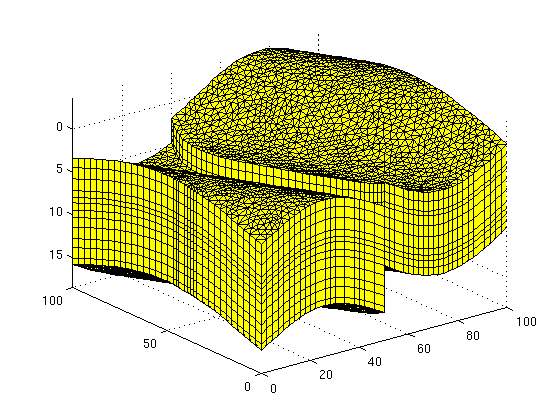
- a triangular areal grid extruded to 3D
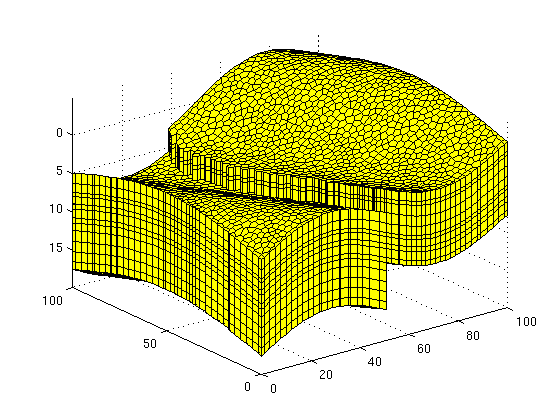
- a dual areal Voronoi grid extruded to 3D
WARNING: The example relies on third-party software:
- Triangle to create the triangulation needed in the areal grids (the 2D PEBI grid is created as the dual of a triangular grid). Triangle was created by J. R. Schewchuk and can be downloaded from his homepage. We have made an automatic build system to call external functions and libraries. This is tested on x86_64-Linux only and may not work on your particular hardware. To avoid the dependence on Triangle, we therefore provide the two grids in the files data/prismatic.mat and data/pebi.mat.
- METIS to partition the unstructured grids. METIS can be downloaded from Karypis Lab. To avoid the dependence on METIS, we provide the partitions used in the paper in the file data/partitions.mat.
Contents
Set up parameters
maxArea     = 4;                % controlling resolution of fine grid
[az,el]     = deal(-42,68);     % view point for plots
useTriangle = false;            % should we use Triangle?
useMETIS    = false;            % should we use METIS?
metisPath   = fullfile('myLocalMETISpath'); % change to local METIS path
vargs       = {'EdgeColor', 'k', 'EdgeAlpha', .05};
Loop over the two grid types
for nr=1:2
Make grid or read it from file
   if nr==1
      if useTriangle,
         G = computeGeometry(extrudedTriangleGrid(maxArea));           %#ok
      else
         dd = fileparts(mfilename('fullpath'));
         load(fullfile(dd, 'data', 'prismatic'));
         clear dd;
         G = Gt; clear Gt;
      end
   else
      if useTriangle,
         G = computeGeometry(extrudedTriangleGrid(maxArea, true));     %#ok
      else
         dd = fileparts(mfilename('fullpath'));
         load(fullfile(dd, 'data', 'pebi'));
         clear dd;
         G = Gp; clear Gp;
      end
   end
   rock = struct('perm', repmat(100*milli*darcy, [G.cells.num, 1]), ...
                 'poro', repmat(0.3,             [G.cells.num, 1]));
   figure, plotGrid(G), axis tight, view(3), grid on, drawnow
Assign boundary conditions
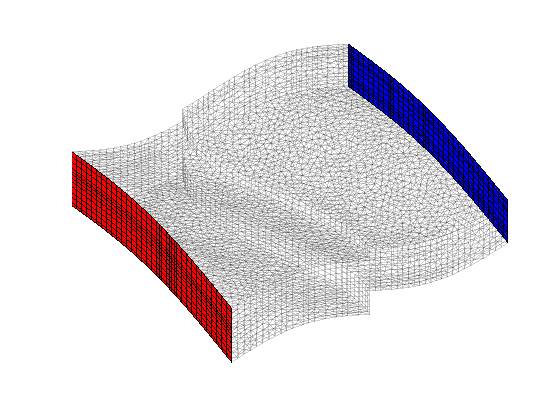
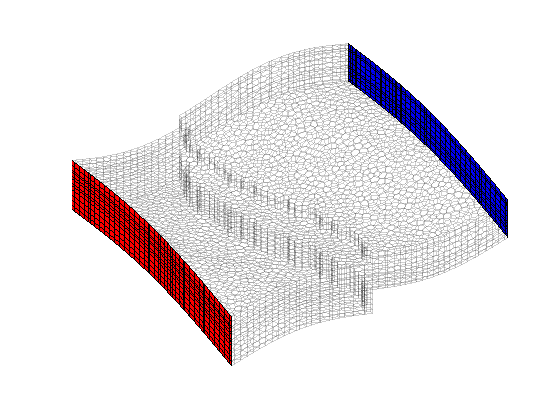
   clf, plotGrid(G, 'FaceColor', 'none', 'EdgeAlpha', .1)
   axis tight off, view(-30, 62)

   % West sides (high pressure)
   d  = abs(G.faces.centroids(:,1) - min(G.faces.centroids(:,1)));
   ws = find (d < 1e6*eps);
   hw = plotFaces(G, ws, 'FaceColor', 'r');

   % East sides (low pressure)
   d  = abs(G.faces.centroids(:,1) - max(G.faces.centroids(:,1)));
   es = find (d < 1e6*eps);
   he = plotFaces(G, es, 'FaceColor', 'b'); drawnow

   bc = addBC([], ws, 'pressure', 250*barsa);
   bc = addBC(bc, es, 'pressure', 100*barsa);
Partition the grid
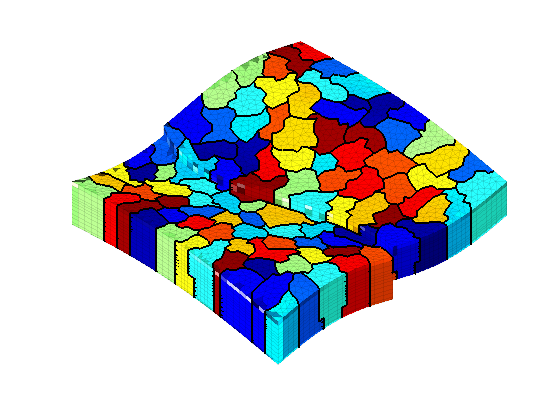
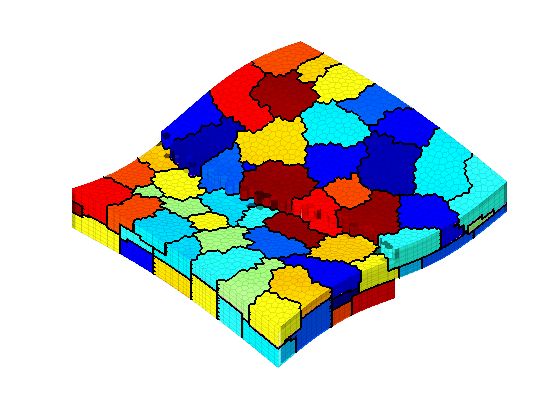
   dd = fileparts(mfilename('fullpath'));
   if useMETIS,
      addpath(fullfile(dd, 'utils'));                                     %#ok
      p = callMetis(G, 100, metisPath);
   else
      load(fullfile(dd, 'data', 'partitions'));
      if nr==1, p = pt; else p=pp; end
      clear pt pp;
   end
   clear dd
   p = compressPartition(p);
   p = processPartition(G, p);
   CG = generateCoarseGrid(G, p);

   clf
   plotCellData(G, mod(p, 11), vargs{:})
   outlineCoarseGrid(G, p, 'LineWidth', 1.5);
   view(az, el), axis tight off
   camlight(az, -1*el), camlight( az, -2*el)
   camlight(az, -3*el), camlight(-az, -4*el), drawnow
Discretize and solve single-phase system
Initialize pressure system
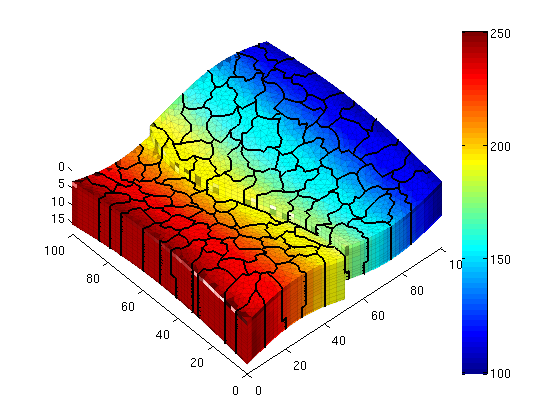
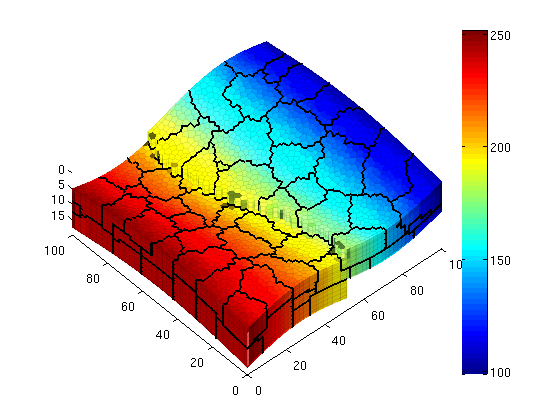
   S     = computeMimeticIP(G, rock, 'InnerProduct', 'ip_quasirt');
   fluid = initSingleFluid('mu', 1*centi*poise, 'rho', 1000*kilogram/meter^3);
   CS    = generateCoarseSystem(G, rock, S, CG, ...
                             ones([G.cells.num, 1]), 'bc', bc);
   xms   = solveIncompFlowMS(initResSol(G, 0), ...
                          G, CG, p, S, CS, fluid, 'bc', bc);
Plot solution
   clf
   plotCellData(G, convertTo(xms.pressure, barsa), vargs{:});
   outlineCoarseGrid(G, CG.partition, 'FaceColor', 'k', 'LineWidth', 1.5);
   axis tight, view(az,el), colorbar
   camlight(az, -1*el), camlight( az, -2*el)
   camlight(az, -3*el), camlight(-az, -4*el), drawnow
end