MRSTlogo_web_banner_light_thinner_Epi.png

Johansen Formation: VE Model Versus 3D Simulation
In this example, we compare the accuracy of a VE simulation to a series of 3D simulations with increasing vertical resolution.

The Johansen formation is a deep saline aquifer in the North Sea, which is considered for storage of CO2 in a future pilot project for CCS at Mongstad, Norway. Here we compare simulations of a 2D cut of the Johansen formation using a 3D simulator with different vertical grid resolutions to a simulation with a vertical equilibrium model. The focus is on the post-injection dynamics, or equivalent, the behavior of the plume far from the injector.

Simulation setup:

  • vertical slice from the Johansen formation,  vertical resolutions in 3D simulator: 5 (original), 10 and 20 cells
  • initial plume: placed in stratigraphic trapping region with an identified spillpoint (right figure)
  • simulation time: 2000 years
  • simplifications: no residual trapping, simple relative permeability, no-flow conditions on all edges
  • permeability/porosity: 200 mD/20 %

The plots in the figure below compare the three 3D simulations with a VE simulation, to which the 3D simulations seem to converge.

Reference:


Initial CO2 saturation distribution for the 3D simulation with 20 vertical cells.

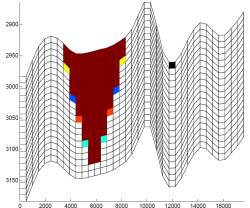
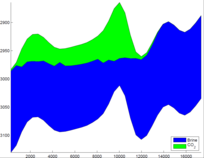
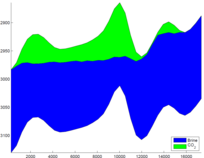
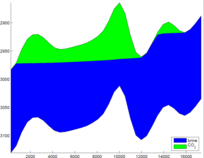
The CO2 distribution after 2000 years of simulation computed with the full two-phase simulator for different z-resolutions (nz=5, 10, 20) compared with a simulation based on vertical equilibrium model (far right). A rather fine z-resolution is needed to get accurate results for the 3D simulator.

Published February 1, 2016