
Direct Pixel-Accurate Rendering of Smooth Surfaces
Academic chapter/article/Conference paper
When visualising scientific results it is important that the images are accurate. One of the focus of the group has therefore been to work on pixel perfect results of the rendered geometry. Where the game industry have been focusing on lighting models and using as course geometry as they can get away with, we are working on ensuring the rendered geometry will be pixel accurate. To do this we prefer working with higher order surfaces that are evaluated into triangles at the latest stage possible, whilst still having real-time to interactive frame rates.
We are also working on processing and visualising very large datasets, either by extracting higher order representations from the triangle soups or by efficient loading and visualisation for the large datasets directly.
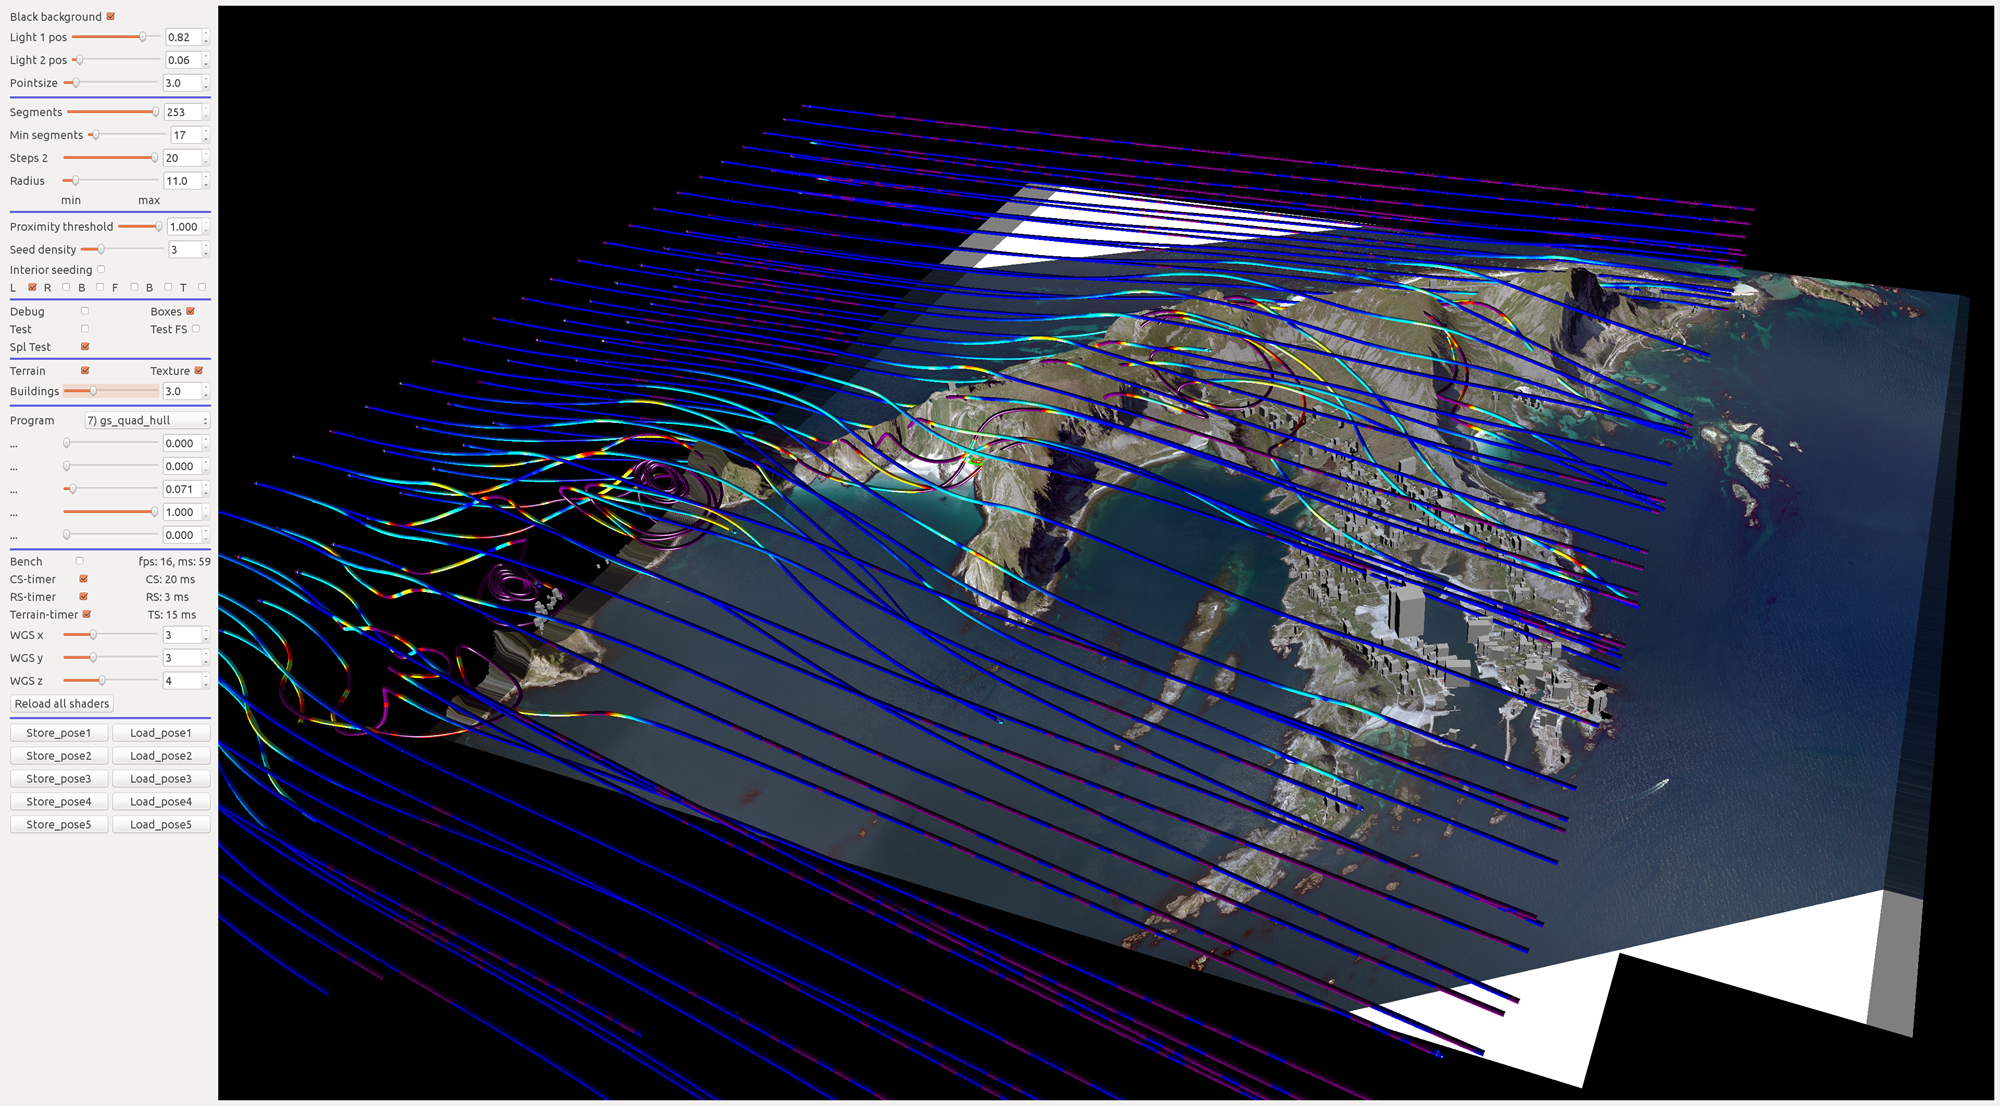
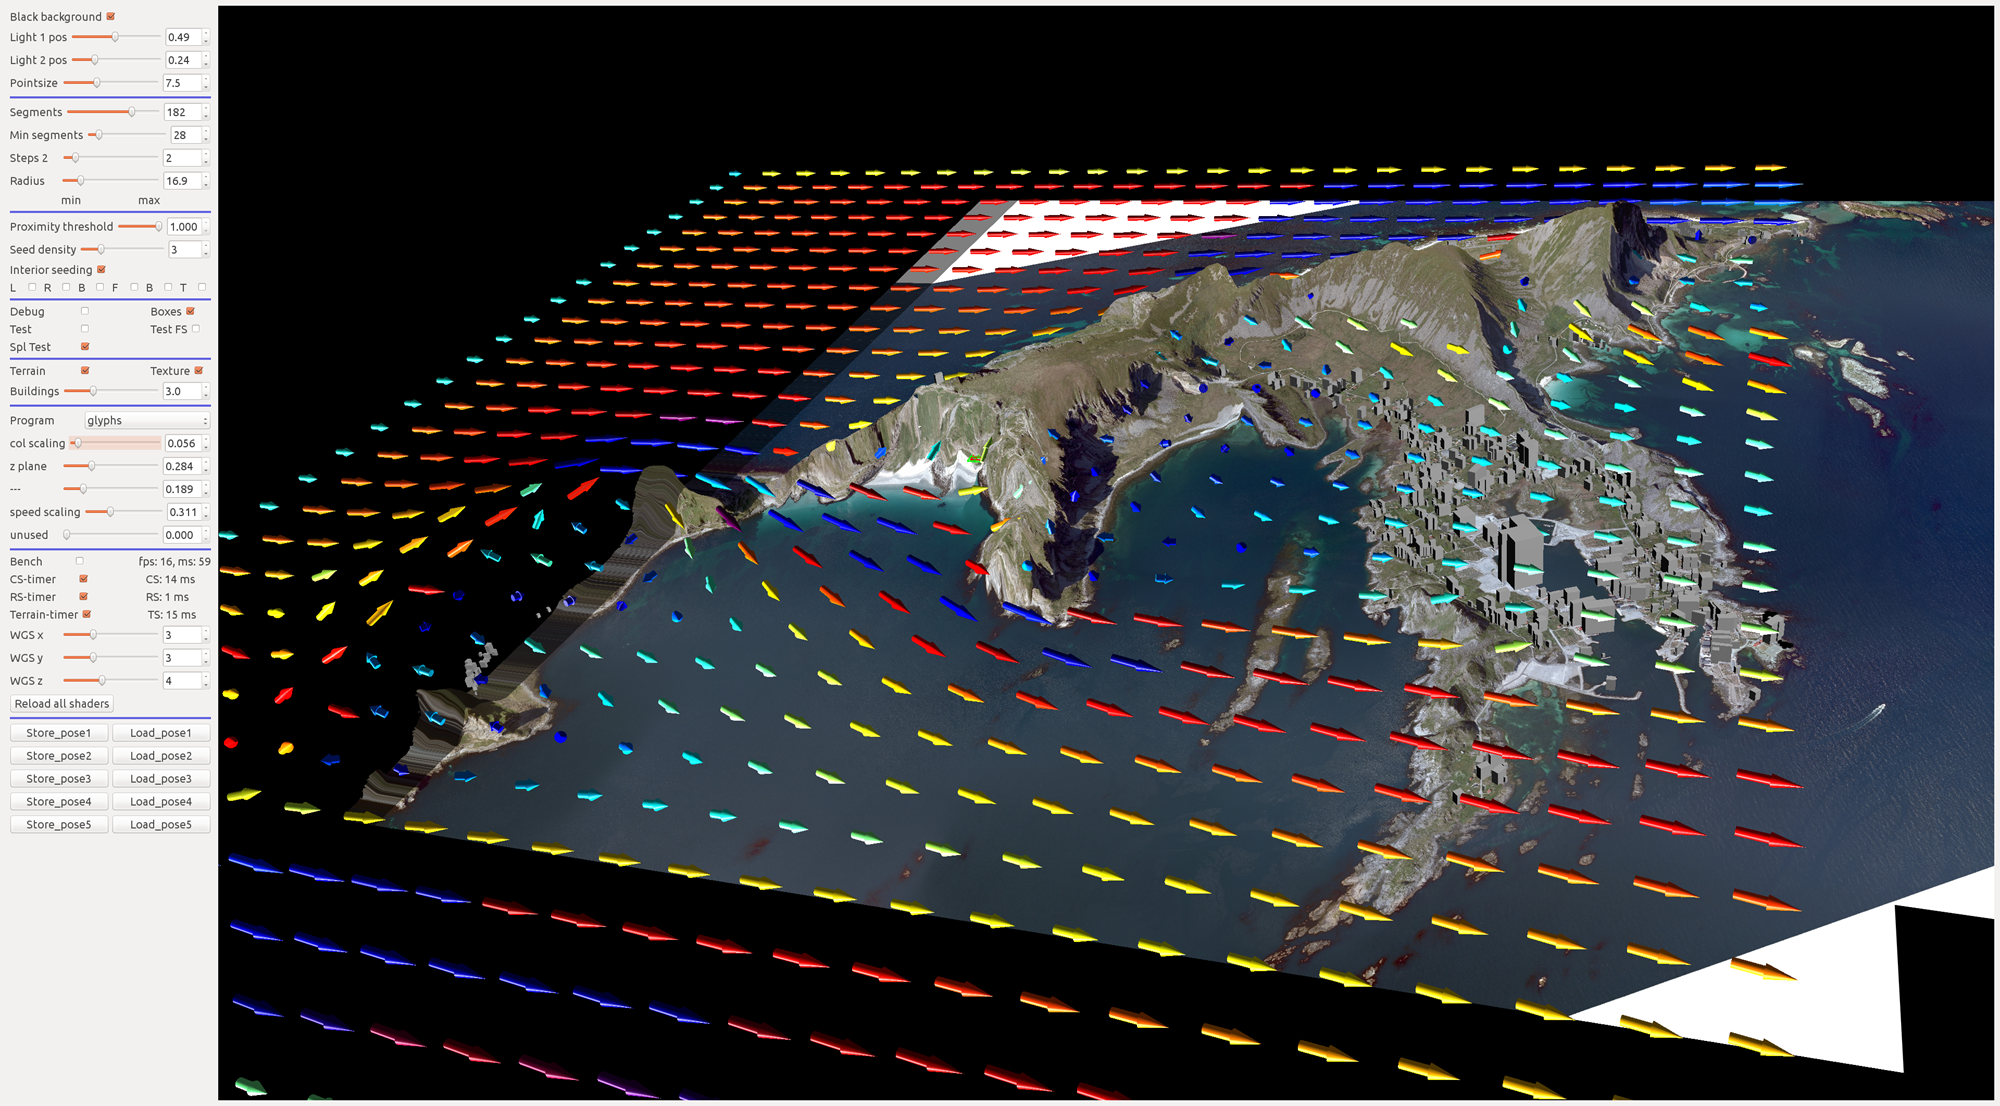
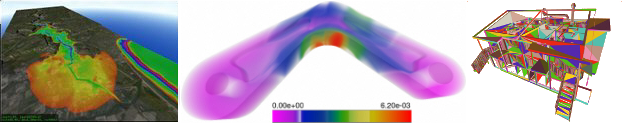
Below you can find a few images showing direct visualisation of a vector field simulating the air currents above the island Verøya. All the work is being done by shaders on the GPU.


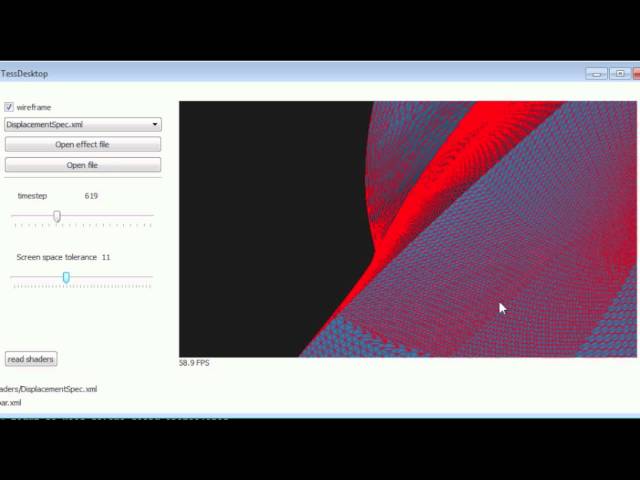
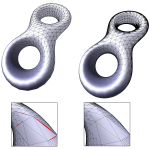
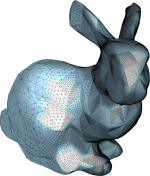
High-quality rendering of B-spline surfaces is important for a range of applications. Providing interactive rendering with guaranteed quality gives the user not only visually pleasing images, but also trustworthy information about the model. In this paper we present a view-dependent error estimate for parametric surfaces. This estimate forms the basis of our surface rendering algorithm, which makes use of the hardware tessellator functionality of GPUs.
We use the screen space distance between the tessellated surface and the corresponding surface point as an error metric. This makes the algorithm particularly useful when visualising additional attributes attached to the surface. An example of this is isogeometric analysis, in which simulation results are visualised along with the surface.


Some examples of our work, ranging from 2016 and back to 2008
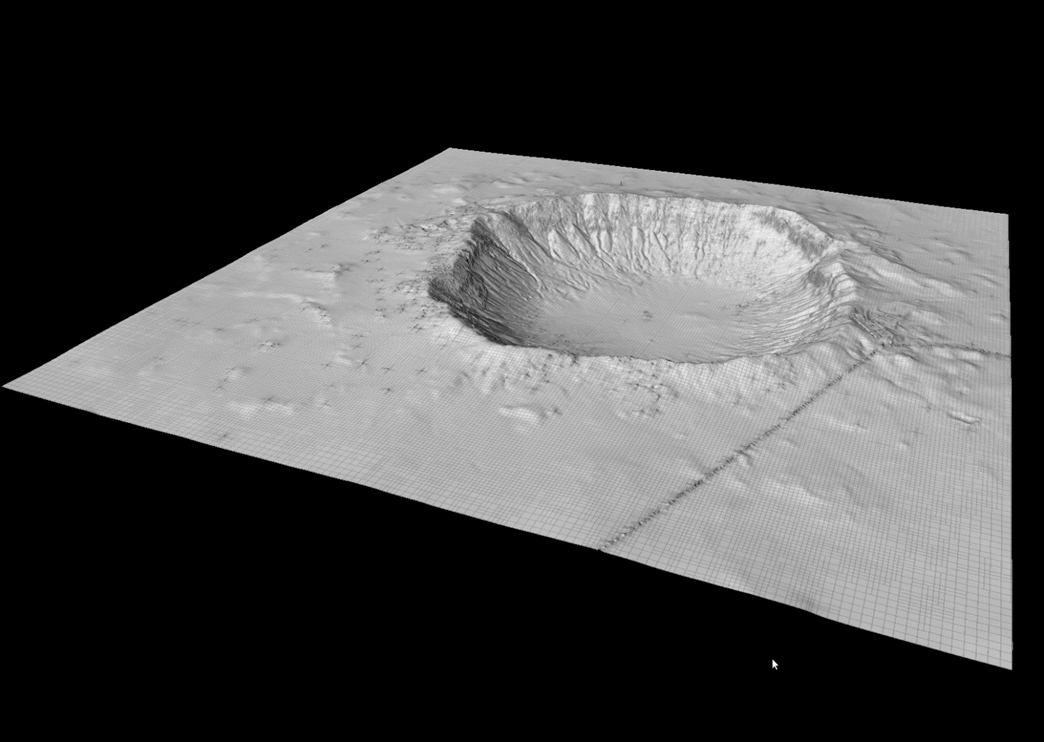
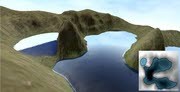
We are not only working with BSplines, but also with LR-Splines, or locally refined splines. These allow for highly refined areas in meshes without having to refine the entire domain.
Some of our work with LR-splines is for rendering terrain like shown in the image on the left.
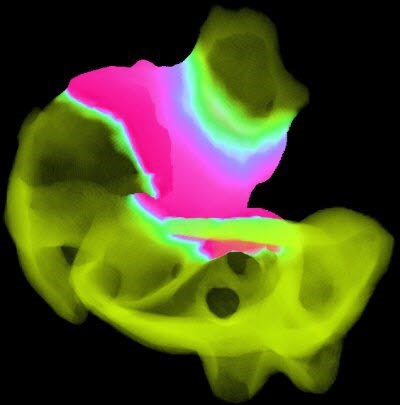
Not only are we able to visualise LR-splines as planes, but also as volumes. An example of this can be seen in the image on the right.
As these are both results of scientific visualisation, like the BSpline visualisation we can guarantee the correctness.

