

|
The Johansen Data Set
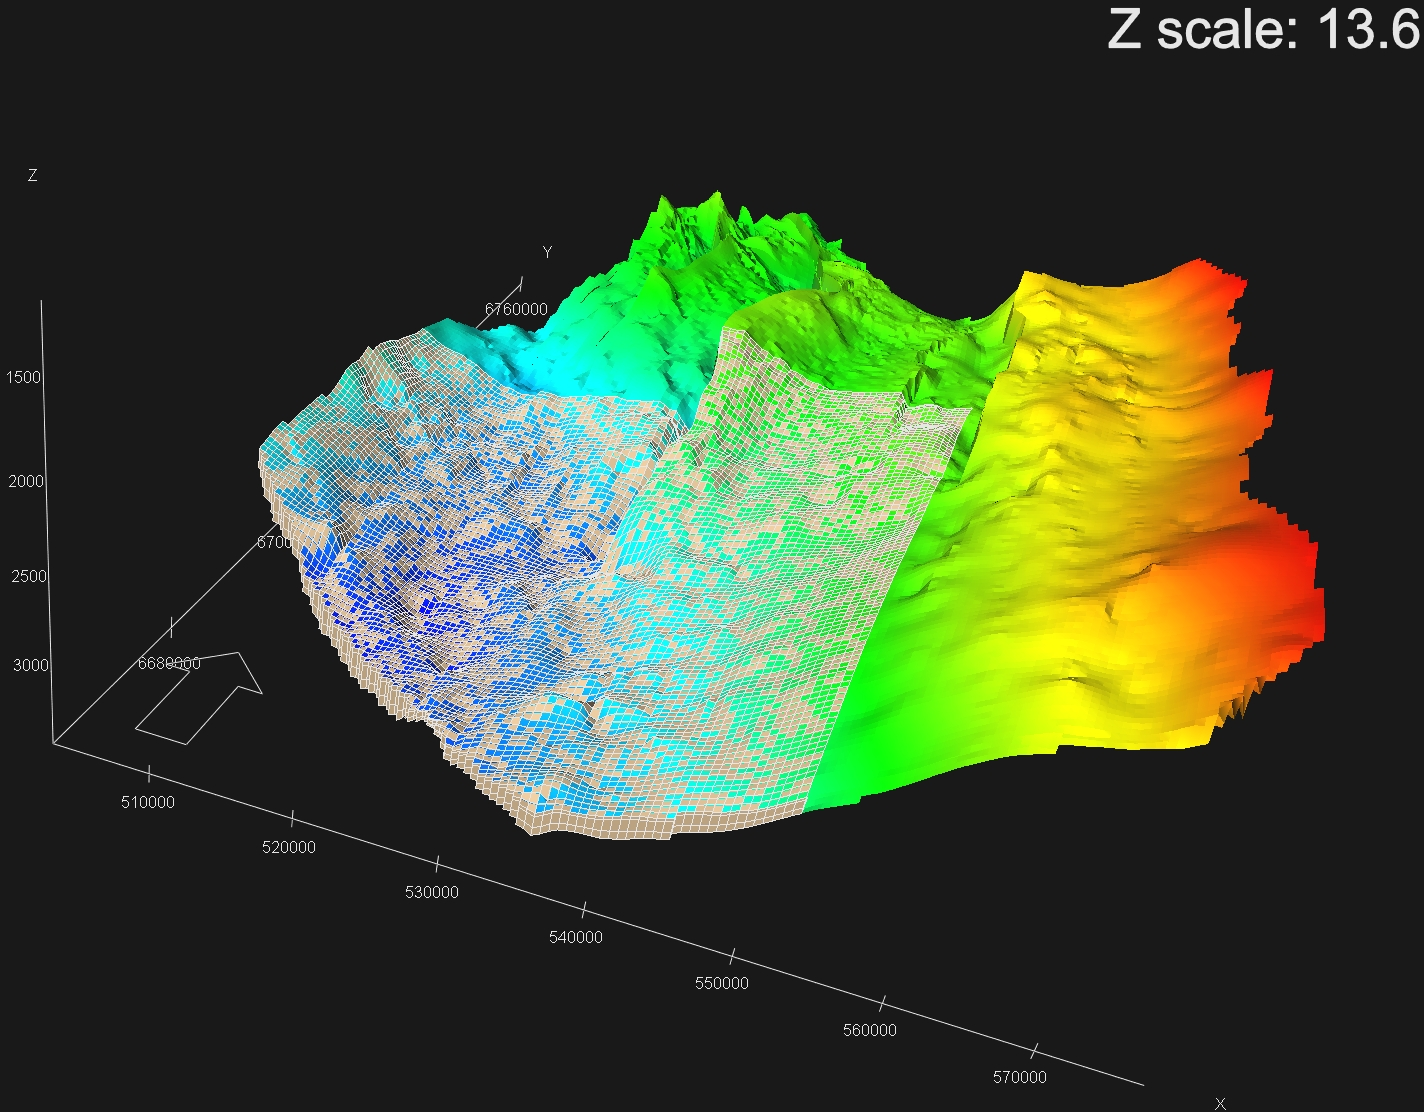
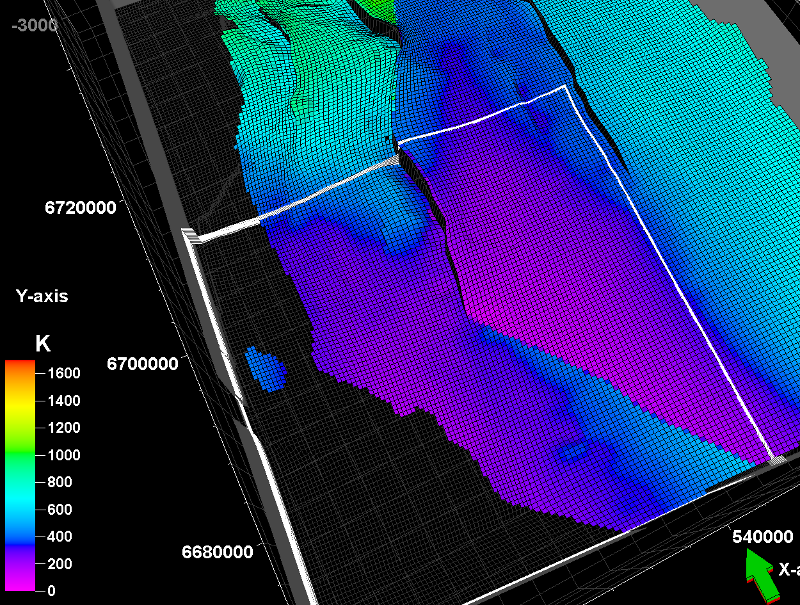
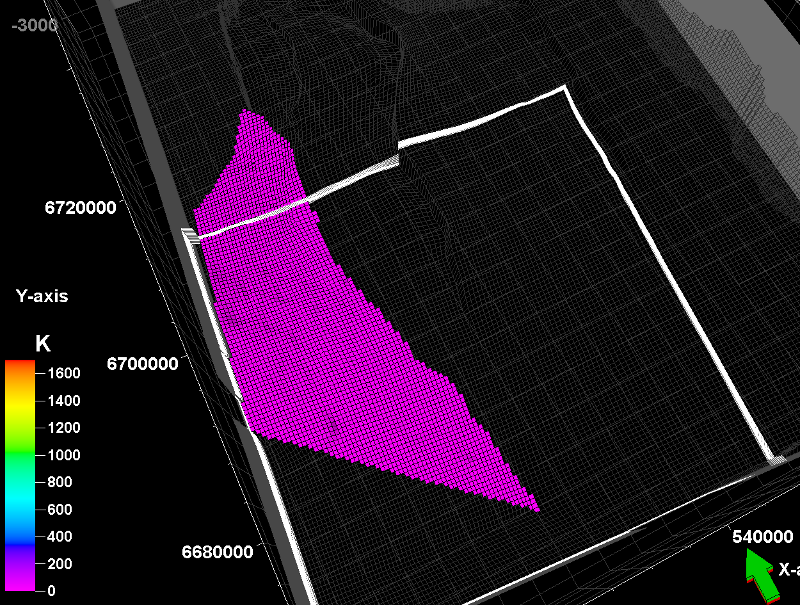
The Johansen formation is a candidate site for large-scale CO2 storage offshore the south-west coast of Norway. As part of the MatMoRA project, we have developed a geological model based on available seismic and well data. By publishing this model online, we seek to provide different modeling groups with a real data set that can be used for comparisons and to calibrate and understand the workings of different computational tools.
Background
Terms of usageThe Johansen dataset is made available under the Open Database License: http://opendatacommons.org/licenses/odbl/1.0/. Any rights in individual contents of the database are licensed under the Database Contents License: http://opendatacommons.org/licenses/dbcl/1.0/. Sector modelsThe simulation grids are made available in corner-point format. This format is an extension of the logical Cartesian grid format. Due to the vertical faulting of geological zones, the corners of grid cells are in general not conforming from one grid block to the neighboring grid block. The full-field model is discretized by a 149x189x16 grid. This grid describes all zones and the entire lateral domain. The Johansen formation is given by 3 layers. The sector models correspond to the south western parts of the geological domain. They are discretized by a 100 × 100 lateral grid with three different vertical resolutions of the Johansen formation:
A sector model with heterogeneous rock properties in the Johansen formation is also provided:
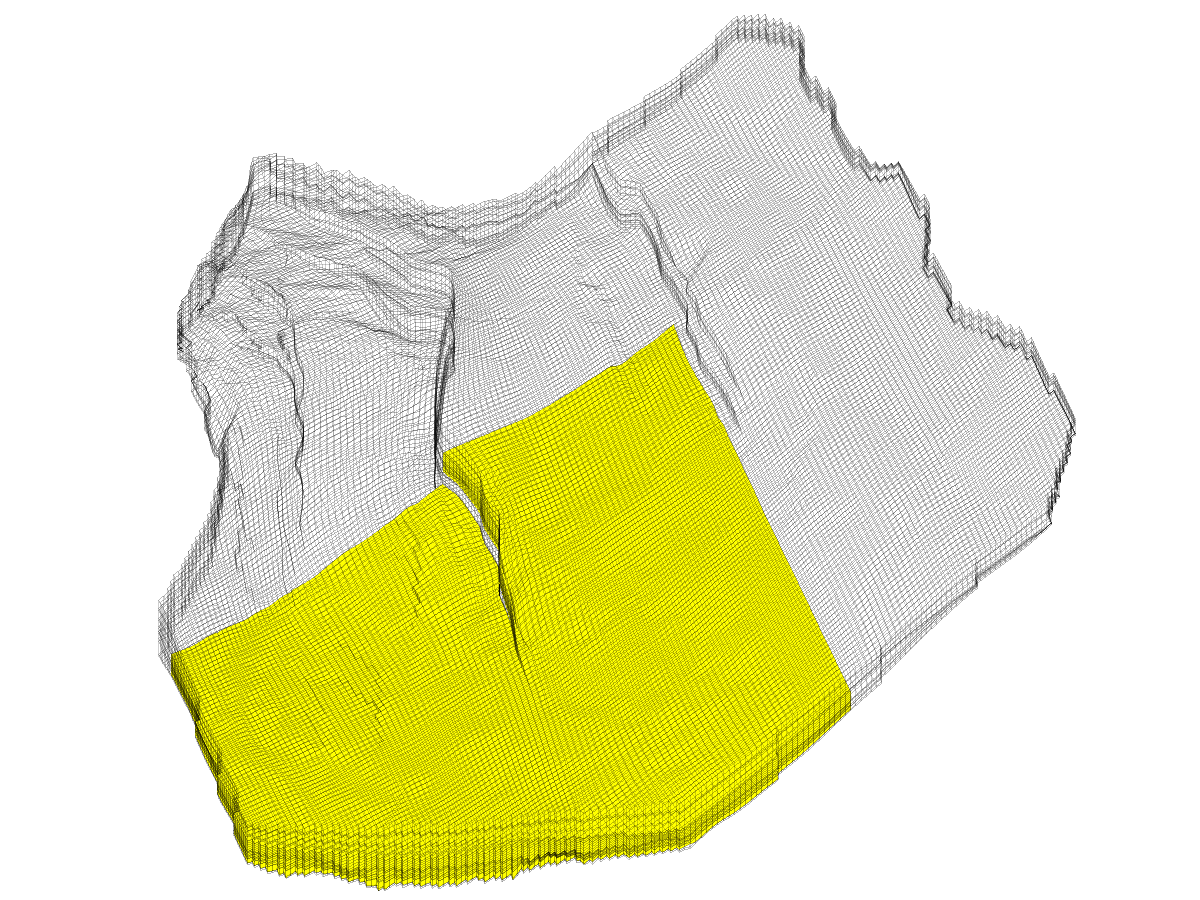
The shale (Dunlin) above Johansen is represented by 5 grid layers in all sector models. Similarly, there is one shale layer below Johansen in all sector models. The geometry files are offered in two formats: either as Eclipse input files (<modelname>.grdecl) or as separate files for pillar coordinates, corner-point depths, and list of active cells. Full-field modelsIn addition to the four sector models, we also offer a full-field model
The sector models all correspond to the same part of the full-field model. Petrophysical data
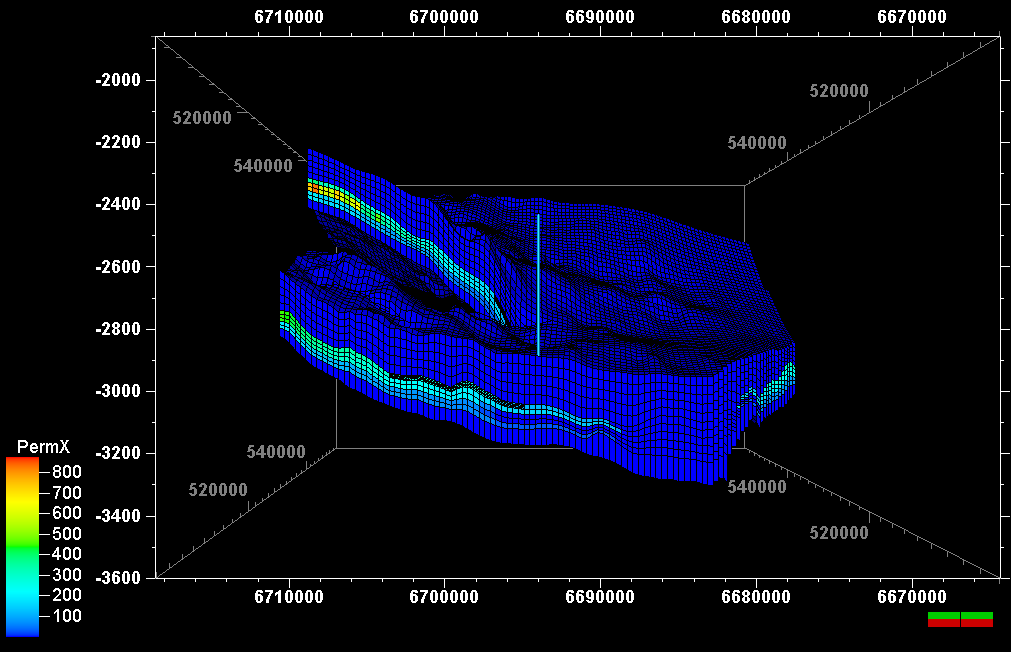
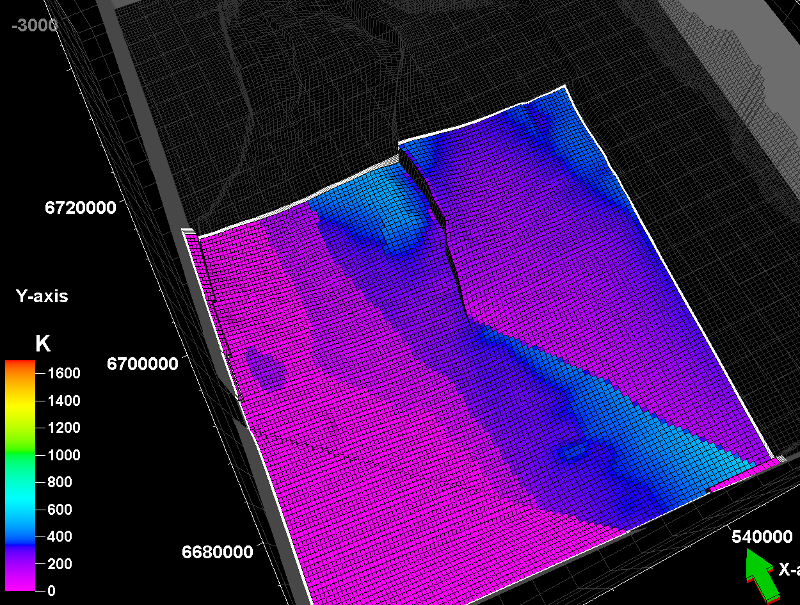
The porosity of the grid is given with one non-negative value between 0 and 1 for each grid cell, including inactive cells. The x-direction permeability of the grid is given with one non-negative value for each grid cell, including inactive cells. In this data set the y-direction permeability is equal to the x-direction permeability while the z-direction permeability is 1/10 of the x-direction permeability. Data files can be extracted from the zip files:
RemarkThe Johansen formation has interbedded shale layers. The full field model is based directly on the geomodel where these shales are represented as pinched out, separate grid layers. In the heterogeneous sector model, the Johansen formation is represented by five grid layers with no pinch-outs. The permeability (and porosity) values are interpolated/mapped from the geomodel. Consequently, a single layer of Johansen in the sector model will consist of a combination of both shale and sandstone properties. Hence, the permeability in layer 6 of the sector model is a combination of the permeabilities of sandstone layer 9 and shale layer 10 in the full field model. Fault dataFaultsA unique identifier (name) and location of each fault in the grid is given. The data files contains the fault name followed by start and end indices of grid cells along the fault and finally the grid cell face of the fault; 'X+' indicates that the fault is located along the face towards the next cell in increasing i-direction. Example: % name Istart Iend Jstart Jend Kstart Kend face
'FAULT3' 43 43 48 48 1 21 'X+'
Data files (extract from zip files):
Transmissibility multipliersTransmissibility multipliers are the same for all faults, consequently we only give the single multiplier value together with the fault cell face numbering. For the homogeneous permeability case, the multiplier is 0.1. Reservoir ConditionsThe reservoir temperature is given as 94 degrees Celsius. The initial pressure is 313.1 bar at 3100 m true vertical depth. Rock dataThe rock compressibility is 4.35·10-5 bar-1 at a reference pressure of 1.0 bar. Fluid dataFluid data is given for an immiscible water-CO2 system at isothermal conditions. PVT data is given for 94 degrees Celsius. PVT dataThe fluid system is an immiscible, two-phase system consisting of water- and CO2-phase. The density and viscosity data for both phases are given as a function of pressure in tabulated form. The isothermal properties for 94 ºC are given for pressure ranging from 230 to 400 bar. Data files [download zip file]:
The data files contains three columns; 1) pressure, 2) density and 3) viscosity. Pressure is given in bar, density in kg/m3, and viscosity in cP. Relative permeabilityThree sets of relative permeability curves are provided for the two-phase water and CO2 system. The relative permeability values are given as a function of the associated phase saturation in tabulated form. Data files [download zip file]:
The data files contain two columns: 1) phase saturation and 2) phase relative permeability. We refer to the accompanying paper for a description of the differences in the relative permeability data sets. WellsWell positioning is given by cell indices used for each simulation grid. The well path intersects the Johansen formation vertically and traverses the midpoints of the grid cells. The rates are constant during the injection period and is set to 1.4 · 104 m3/day at reservoir conditions. The well data files contains the i-, and j-direction indices of the vertical column of perforated cells, then the start and end k-direction indices of the perforated interval. Data files (extract from zip files):
|
|

Project 178013 funded by the Climit programme