|
Flow diagnostics
Flow diagnostics are simple and controlled numerical flow experiments run to probe a reservoir model, establish connections and basic volume estimates, and measure dynamic heterogeneity. Flow diagnostic quantities are quick to compute and can thus be used interactively to explore fluid communication in a geological model before or after more comprehensive multiphase flow simulations.
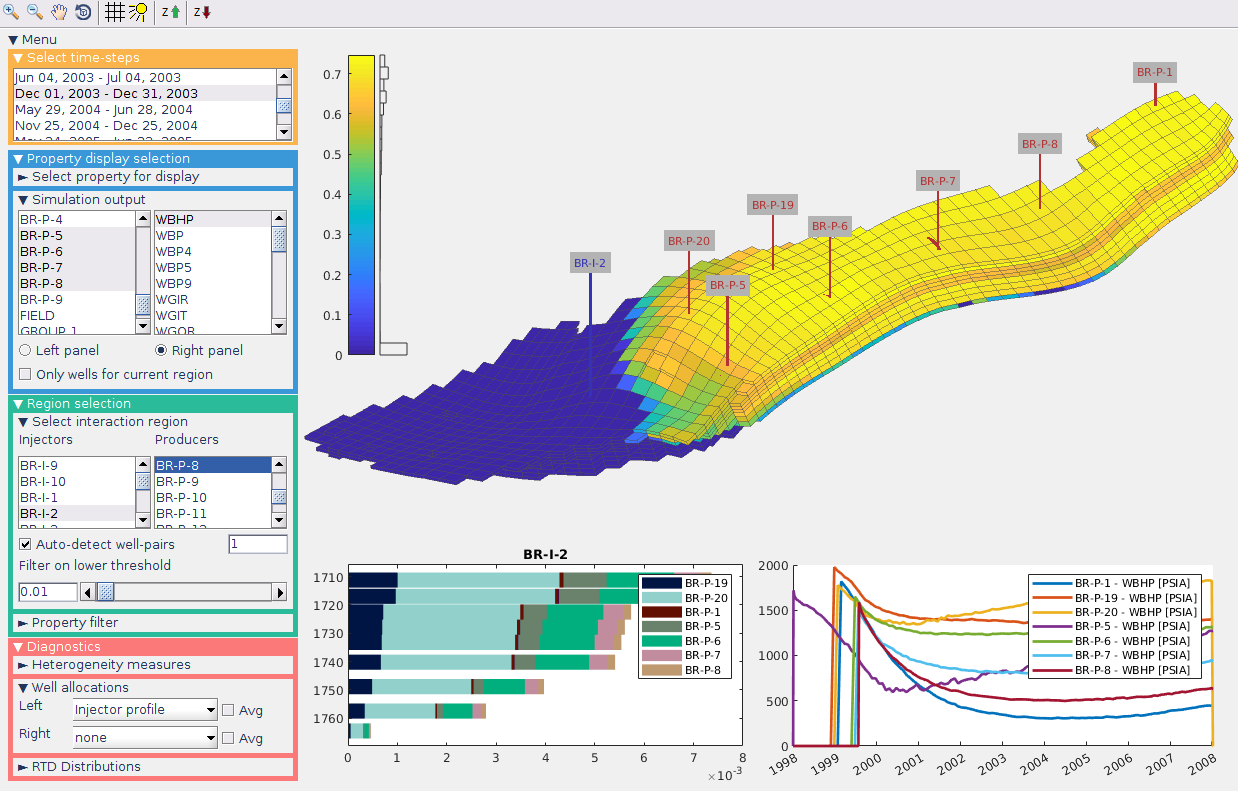
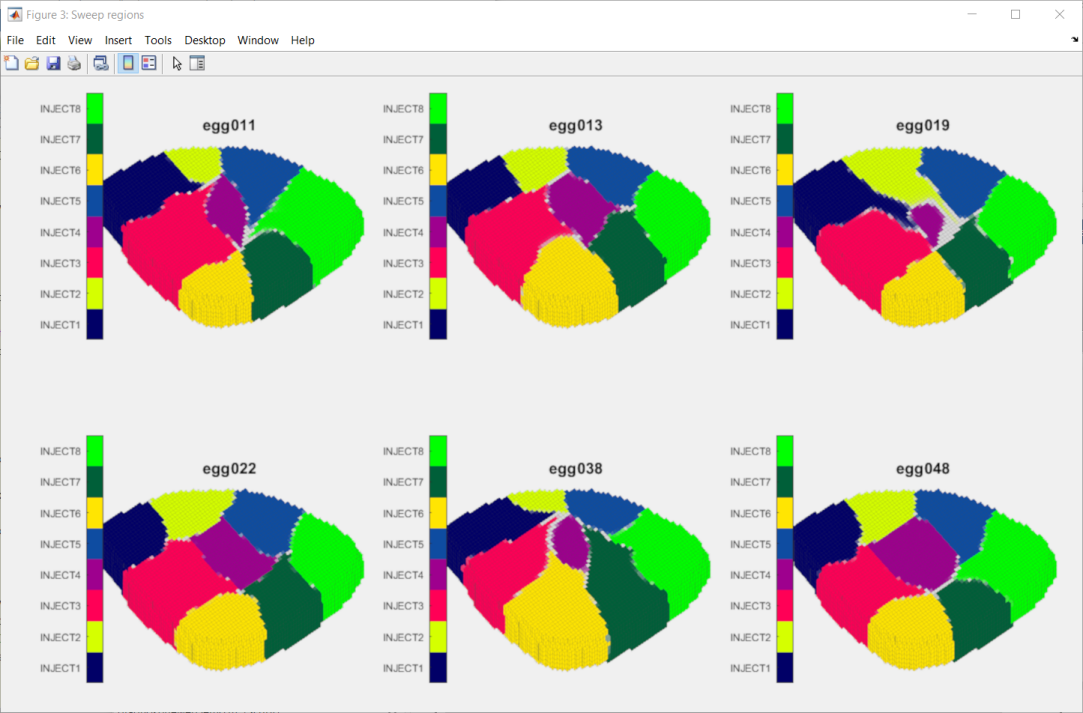
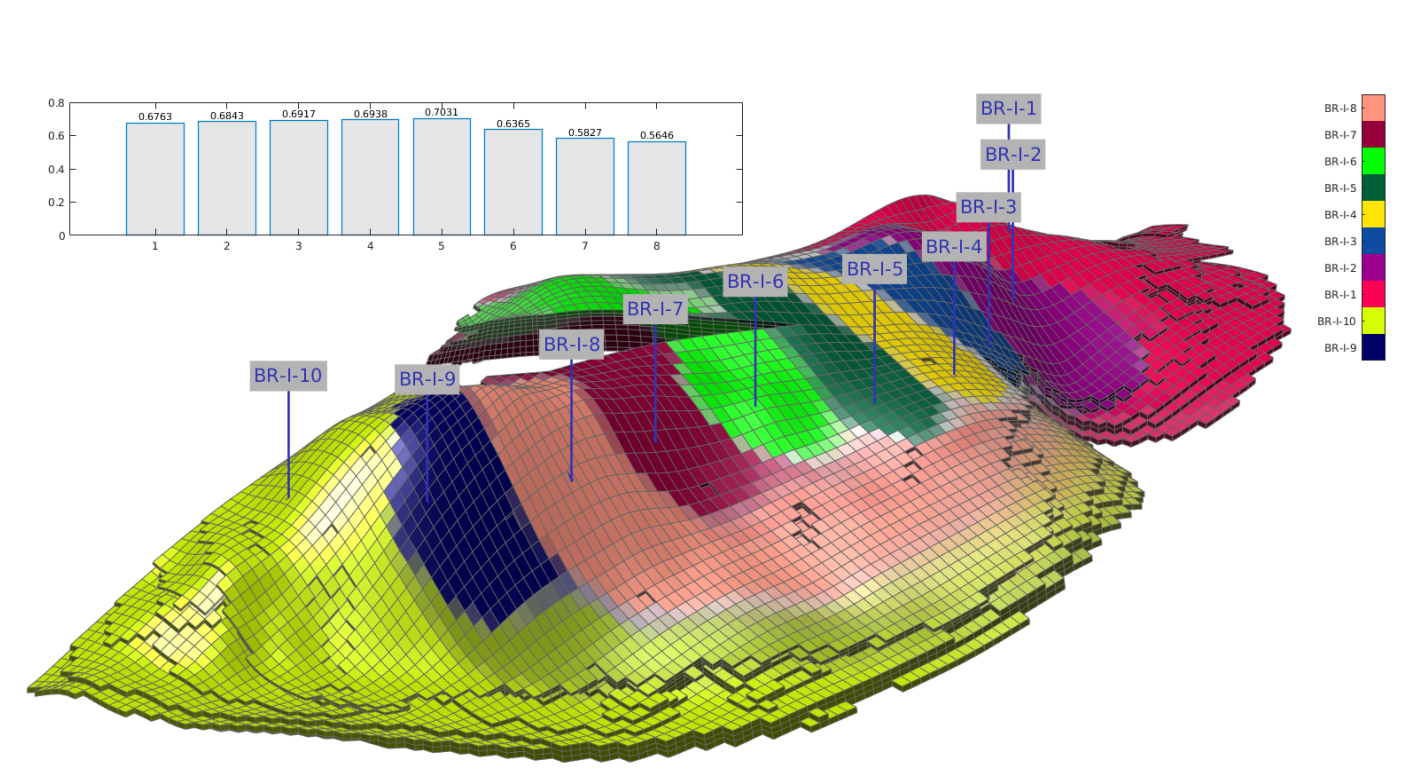
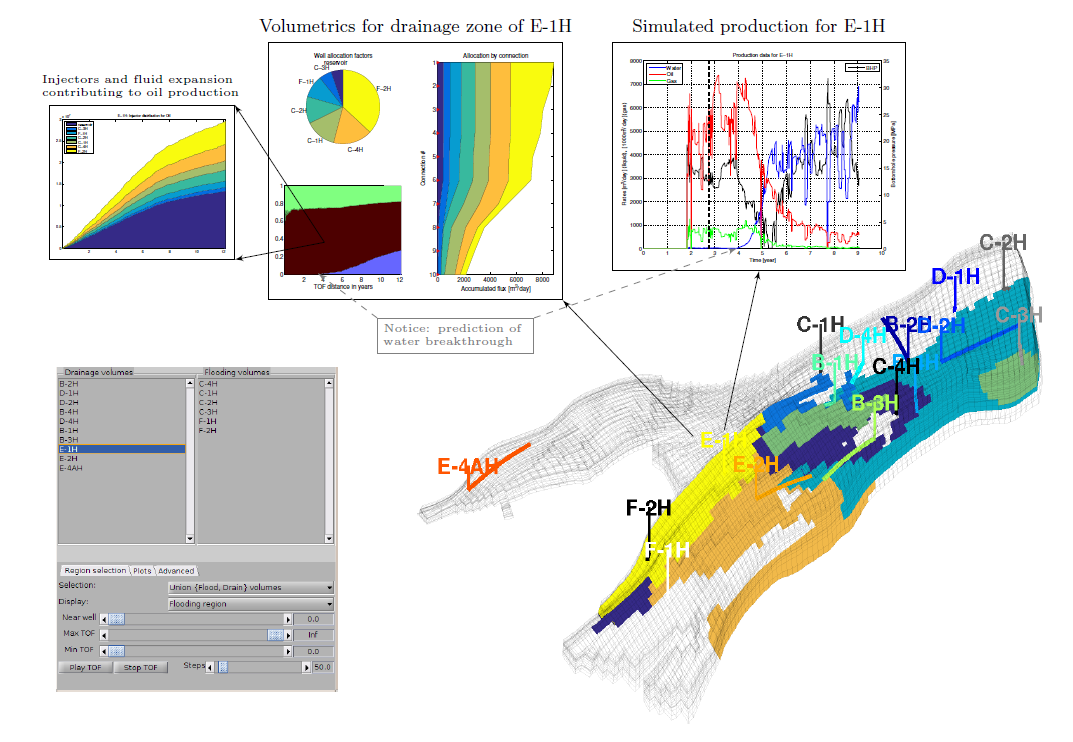
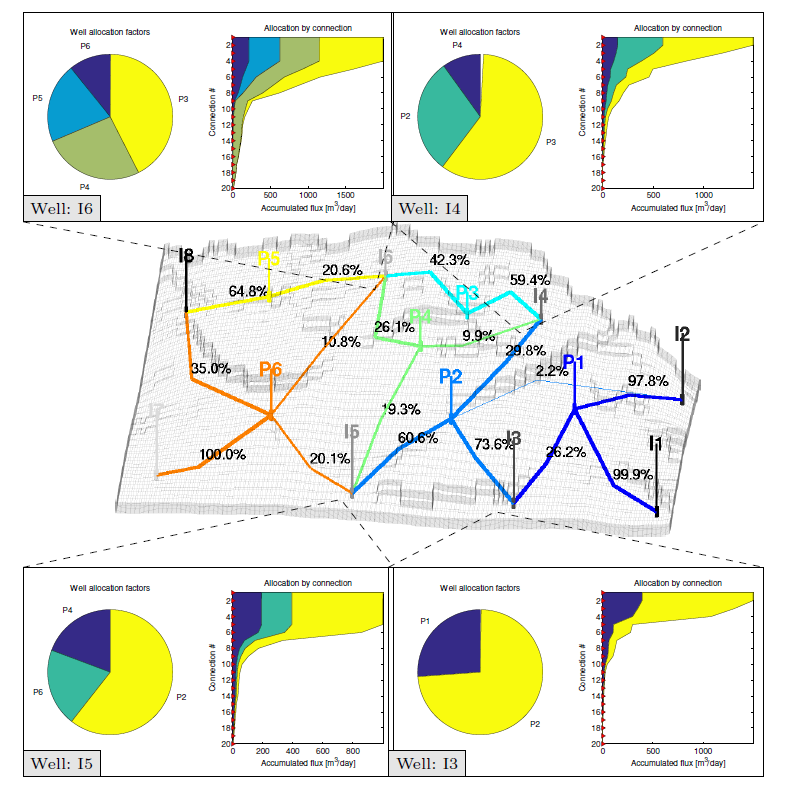
BackgroundTo choose the right recovery strategy and optimize its field-scale efficiency, reservoir engineers need to develop a qualitative understanding of the reservoir, explore alternative well placements, and consider different techniques for mobilizing immobile oil and improving sweep efficiency, etc. Cause and effect knowledge for the field as a whole is built by iteratively perturbing model parameters, but the ability to explore different scenarios is often limited by the high computational cost of multiphase simulations and not much rigorous work has been done on field management optimization. There is a strong need for efficient and intutive prescreening and post-processing tools to complement advanced multiphase simulations in assessing the effect of static and dynamic heterogeneity and uncertainty in reservoir description, explore field-scale performance of alternative recovery strategies, and generally provide better decision support to optimize development and production plans. Flow diagnosticsFlow diagnostics refers to simplified numerical simulations a reservoir engineer can use to quickly locate regions likely to remain unswept, understand how injectors and producers communicate, estimate sweep and displacement efficiency, compute allocation factors, and generally assess the effect of heterogeneity and uncertainty. Flow diagnostics give a set of visually intuitive quantities that:
All these quantities are quick to compute and can thus be used interactively to explore fluid communication in a geological model before or after more comprehensive multiphase flow simulations. Use of flow diagnostics to prescreen and post-process accurate reservoir models, or ensembles of such models, will make better use of dynamic simulations and reduce the turnaround time for modeling workflows, e.g., by reducing the need for upscaling, reducing ensemble sizes, improving selection of representative sector models, etc. Flow diagnostics can also be used as surrogate models providing recovery factors and economic quantities like net present value.
Additional literature
DownloadThis module is included with MRST from version 2012b and onwards under the name 'diagnostics'. |
||||||||||||||||||||||||||||||||||||||||||